


There are various risk scores to predict mortality risk among patients admitted for acute coronary syndrome (ACS), such as the Thrombolysis in MI (TIMI) score, Global Registry of Acute Coronary Events (GRACE) risk score and the Platelet glycoprotein IIb/IIIa in Unstable angina: Receptor Suppression Using Integrilin (eptifibatide) Therapy (PURSUIT) score.1
The GRACE registry, a global registry of ACS patients from 94 hospitals in 14 countries, developed two models to estimate the risk of in-hospital and 6-month mortality among all patients with ACS.2
The GRACE risk score predicts 6-month mortality after a patient has been discharged following hospital admission for ACS. It uses a predictive logistic model with eight prognostic variables (Supplementary Material Figure 1) to determine a patient’s probability of death due to any cause during the first 6 months after discharge.3
We must be mindful of the geographical differences and patient characteristics in the original GRACE study when applying this risk score to other populations, with validation required to avoid erroneous results in risk calculations.4 Thus, the aim of this study was to validate the GRACE risk score in an Asian medical centre to determine whether the probabilistic model can be used outside of the geographical and patient environment in which it was created.
Methods
Patients
This study included 428 patients aged ≥18 years who were admitted to Hospital Sultanah Aminah, Johor Bahru, Malaysia, between January and April 2018 for acute coronary syndrome (ACS). The initial cohort contained 440 patients, but 12 (2.7%) patients were excluded because they did not have valid data for calculating the GRACE score or vital status 6 months after discharge. The study included all patients presenting with chest pain suggestive of ACS and admitted for further treatment. A diagnosis of ACS was made based on presenting symptoms, ECG and cardiac biomarkers.All patients were treated with dual anti-platelet therapy, anticoagulants, statins, angiotensin-converting enzyme inhibitors or angiotensin-receptor blockers and β-blockers where possible.
Risk Score
The GRACE score was calculated using the online calculator (Version 2.0; https://www.mdcalc.com/grace-acs-risk-mortality-calculator), as described previously.5,6 The eight variables that constitute the GRACE score are age, history of heart failure, history of acute MI, heart rate and systolic blood pressure (SBP) at admission, ST-segment depression, serum creatinine at admission and elevated myocardial necrosis markers or enzymes.
Data Collection
For this retrospective study, a database was created to collect relevant data, which were then stored in spreadsheets, and in accordance with the GRACE score variables. Most of the information was obtained between January and April 2018 from an in-house database, which included 10 patient-related factors, five cardiac-related factors and three operation-related factors. Out-of-hospital data, including death or late complications, were obtained via reviewing patient outpatient clinic notes.
The GRACE score was calculated for each patient by adding the points for each of the eight prognostic variables used to calculate the score, namely age, history of heart failure, history of acute MI, heart rate and SBP at admission, ST-segment depression, serum creatinine at admission and elevated myocardial necrosis markers or enzymes (Supplementary Material Figure 1).
Statistical Analysis
Universal sampling was used. Data were entered into a Microsoft Excel database and analysed using SPSS version 22.0. Continuous variables are reported as the mean ± SD. Univariate analysis of dichotomous variables was performed using the χ2 or Fisher’s exact test. Pearson and Spearman tests were used for correlational analyses of continuous variables.
Receiver operating characteristic (ROC) curve analysis was performed to estimate the discriminant ability of the risk scoring method to predict immediate postoperative adverse events. The calibration of the risk-scoring method was estimated as the area under the ROC curve (AUC) with 95% CIs. Survival analysis was performed by the Kaplan–Meier method. ROC curve analysis was used to estimate the performance of the risk score in predicting mortality at the 6-month follow-up. P-value of <0.05 was considered statistically significant.
Calibration of Analysis
Model calibration was evaluated using the Hosmer–Lemeshow goodness-of-fit test because this test is useful for validating an existing logistic model with an external database.7 Values of p>0.05 indicate that the model is well adjusted to the data and is therefore a good predictor, in this case, of patients’ probability of death.
Results
Baseline Characteristics
The baseline characteristics of the study population are provided in Supplementary Material Table 1. Of the 428 patients in this study, 307 (72%) were male and 50% of the study population was Malay. Most patients had hypertension and nearly half had diabetes with dyslipidaemia.
Of the 428 patients in this study, 208 (48.6%) were admitted for unstable angina and 92 (21.5%) were admitted for ST-elevation MI (STEMI). Thirteen (3%) patients had a cardiac arrest upon arrival at hospital. The frequencies of GRACE risk score variables in our cohort are presented in Supplementary Material Table 2.
Mortality
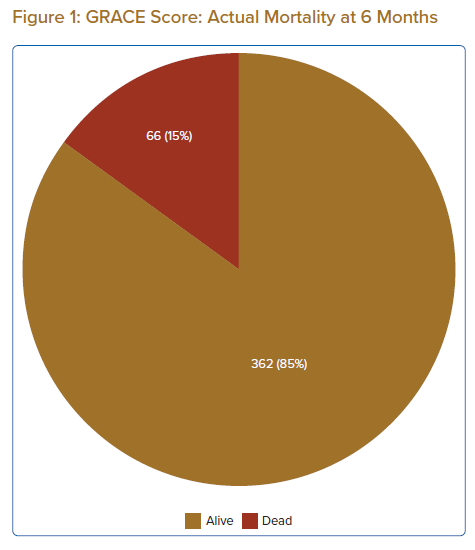
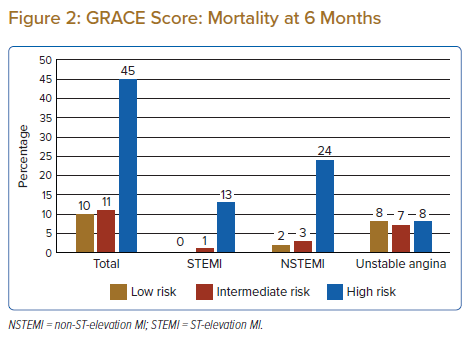
By 6 months after discharge, 66 (15%) patients had died. Figure 1 shows the number of mortalities at the end of the 6-month follow-up period, whereas Figure 2 shows the distribution of mortality at 6 months in each of the low-, intermediate- and high-risk categories. The mortality rate increased significantly as the GRACE risk category increased. In addition, the GRACE risk score increased with advancing age (Supplementary Material Figure 2).
Factors Affecting Prognosis
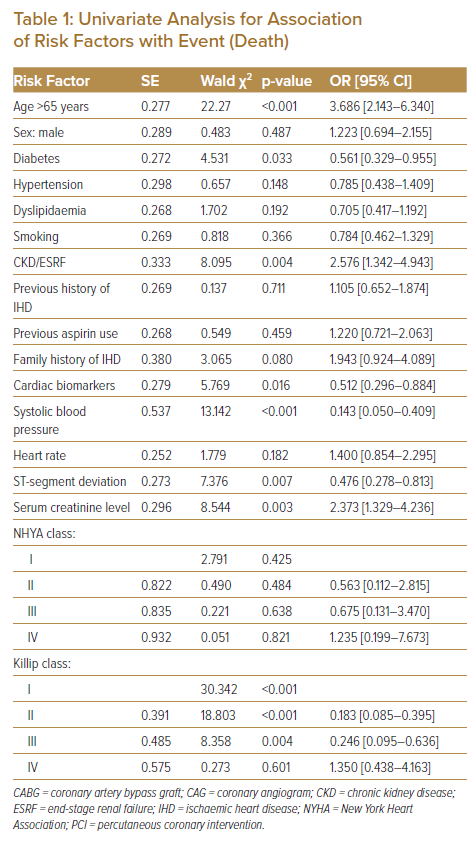
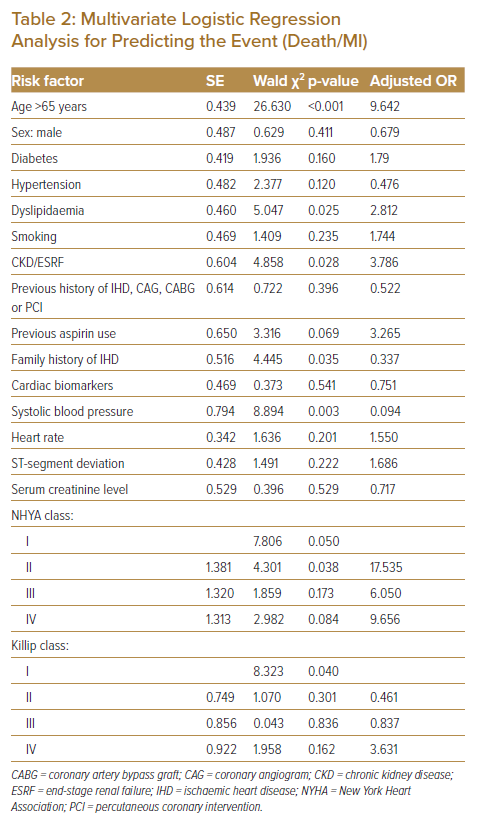
Univariate and multivariate analyses were conducted to assess the risk associated with the baseline characteristics and to evaluate the predictive accuracy of the composite GRACE risk score (Tables 1 and 2).
Age
The mortality rate increased with increasing age, with multivariate analysis revealing a good association between age and death (OR 9.642, 95% CI [4.077–22.803], p<0.001). In this study, we used a cut-off value of 65 years and compared GRACE risk scores between those aged ≥65 and <65 years. The mean GRACE risk score was significantly (p<0.001) higher for patients aged ≥65 than <65 years (116.17 ± 30.16 versus 84.85 ± 34.32, respectively).
Dyslipidaemia
Dyslipidaemia is strongly associated with cardiovascular mortality. In the present study, 189 (44%) patients had high cholesterol, and this showed a trend towards statistical significance (OR 2.812, 95% CI [1.141–6.928], p=0.025).
Chronic Kidney Disease
The median serum creatinine level in our study population was 88 mmol/l. Multivariate analysis indicated that patients with chronic kidney disease (CKD) had a poorer prognosis (OR 3.786, 95% CI [1.159–12.367], p=0.028).
Family History of Ischaemic Heart Disease
Despite only 94 (21.9%) patients having a family history of ischaemic heart disease, it proved to be strongly associated with mortality (OR 0.337, 95% CI [0.123–0.926], p=0.035).
Systolic Blood Pressure
The mean SBP in the study population was 149 ± 32 mmHg. There was a significant difference in mean SBP between patients alive at 6 months and those who died (153 ± 31 versus 131 ± 27 mmHg, respectively; p<0.001). Multivariate analysis revealed that decreasing SBP was associated with mortality (OR 0.094, 95% CI [0.020–0.444], p=0.003).
New York Heart Association Class
New York Heart Association (NYHA) class is not one of the parameters used to calculate the GRACE risk score but, in our study, there was a statistically significant association between NYHA class II and mortality (OR 17.535, 95% CI [0.112–2.815], p=0.038). This is likely to be due to most patients being classified as NYHA class I or II.
Killip Class
A higher Killip class was associated with higher mortality and worse prognosis. In the present study, Killip class I was statistically significant compared with mortality (p=0.040), but this was most likely due to most patients (70%) being in Killip class I, which skewed the statistical calculations.
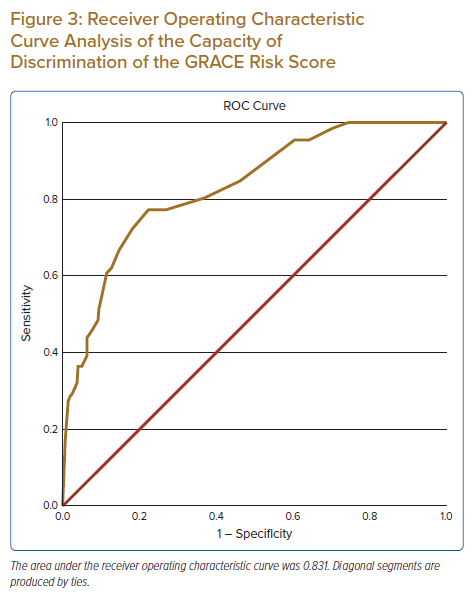
Calibration and Discrimination
Model calibration was excellent for our cohort population, with the validated model showing an adequate capacity for discrimination after calibration (Hosmer–Lemeshow goodness-of-fit test). The AUC was 0.831 (95% CI [0.778–0.884], p<0.001; Figure 3).
Discussion
Accurate prediction of risk in ACS is important to ensure appropriate and optimised interventions. The GRACE risk score stands out as being simple to use in the clinical setting, with evidence showing that it performs better than similar ACS risk models.8 Moreover, the GRACE risk score can be applied across all cases of ACS, be they non-STEMI (NSTEMI) or STEMI. Furthermore, the validity of the GRACE risk score has already been tested in populations from several countries.8
The use of the GRACE score has been recommended by clinical practice guidelines.9,10 However, proper use of the scoring system requires a properly contextualised validation to ensure that it will provide correct information and probabilities. This study is the first validation study on the GRACE risk score in Malaysia. In this study, the GRACE risk score was calibrated using the Hosmer–Lemeshow goodness-of-fit test with an AUC of 0.831 (95% CI [0.778–0.884]). This indicates that, in our cohort, the model offers an excellent calibration of probability of mortality at 6 months after discharge from hospital following admission for ACS.
In this study, increasing age showed a strong association with mortality, with patients aged >65 years being at particularly high risk. Elderly patients aged >65 years with ACS tend to be under-represented in clinical trials and undertreated, with both invasive and pharmacological therapy.11 Hence, we chose a cut-off age of 65 years for analysis in the present study. The mean GRACE risk score for patients aged ≥65 years was 116.17 ± 30.16 years, significantly (p<0.001) higher than the mean GRACE risk score of 84.85 ± 34.32 among those aged <65 years.
As observed in the GRACE registry (OR 1.4 for every 10 mmHg decrease in SBP), in the present study a lower SBP on admission was associated with higher mortality at 6 months after discharge.3 In addition, a number of studies have shown that patients with CKD, with or without long-term dialysis, are at a prognostically significantly higher risk of death.12,13 Patients with ACS and CKD are associated with poorer short- and long-term outcomes; these cases are more complex and there is a lack of well-designed randomised clinical trials assessing therapeutic strategies in this group of patients.12,13
Dyslipidaemia with high total cholesterol, LDL, triglycerides and low HDL is one of the major risk factors in patients admitted for ACS.14 Current guidelines advocate that the lower the LDL, the better the prognosis of patients, with a target LDL of <1.4 mmol/l in the very high-risk group.15 Our analysis was consistent with these findings, showing that LDL level was a significant predictor of mortality (p=0.025).
A family history of ischaemic heart disease in patients with ACS is important, especially in younger patients or those with no initial elevations in high-sensitivity troponin T concentrations.16,17 A positive family history of ischaemic heart disease is a major risk factor for coronary artery disease, which predisposes to atherosclerosis at a younger age.17 A study in South Korea showed that patients with a family history of ischaemic heart disease were younger and more likely to be male.18 In the present study, having a family history of ischaemic heart disease was associated with more cardiovascular events (p=0.035).
In this study, mortality was higher than in the GRACE registry (15% versus 4.8%, respectively).3 Of the 92 patients admitted for STEMI, only 43.5% had a coronary angiogram including primary percutaneous coronary intervention (PCI) or rescue PCI, whereas 47.8% had thrombolysis. The remaining cases were late presentations MI or spontaneous resolutions of MI. The higher number of patients receiving thrombolysis is due, in part, to the unavailability of cath labs. As can be seen in Figure 2, a relatively high number of patients with low GRACE risk scores died compared with intermediate- and high-risk patients. Most of the deaths were due to recurrent admission for heart failure, hospital-acquired infections or non-cardiac causes.
In the present study, there was a significant association between NYHA class and mortality (p<0.050), but NYHA class is not included in the GRACE risk score. NYHA class is strongly associated with mortality, with higher NYHA class therefore warranting close attention during admission.19 Higher Killip class is associated with severe angiographic coronary artery disease and worse ventricular function.20 In the present study, only Killip class I was a significant predictor of mortality, and this could be because most of the patients were in Killip class I and experienced recurrent admissions for complications of MI, such as heart failure, or other non-cardiac problems.
The GRACE risk score calculator is easily available via a smartphone application and fulfils the fundamental criteria for a prognostic score, namely accuracy, ease of use and generalisability.
Study Limitations
Because of this was a single-centre study with a relatively smaller database, some prognostic variables may not be statistically significant despite showing good association with mortality. In real-word practice, recalculation of risk scores during a patient’s hospital stay is needed for a more dynamic assessment because risk stratification is a continuous process.
Conclusion
The GRACE risk score for predicting mortality was validated in our population and could be used to estimate the risk of death at 6 months for our ACS patients. More studies, preferably multicentre studies, are needed to confirm our findings and validate all the GRACE risk score parameters.