


Body composition of fat and lean body mass has an interracial or interethnic variation.1,2 It is a complex interplay of genetic and environmental factors. Much research has advocated the need to conduct studies in different countries to identify these differences and how they affect health. For the most part, the burden of cardiovascular risk and death was attributed to obesity, which is probably due to the industrialisation of different commercialised food products. It is a modifiable risk factor that is defined as an excess of body fat associated with increased morbidity and mortality.3 The opposite of obesity is underweight. Both conditions are considered to be an unhealthy body mass.4 Underweight is uncommon in developed countries but is a problem in many developing countries, such as the Philippines.5 It is correlated with different factors like malnutrition, inadequate caloric intake and the presence of chronic diseases.4 However, recent studies have shown that being underweight may be an important clinical marker for cardiovascular risk of hypertension, diabetes, and even dyslipidaemia in a certain subset of the population.6–8 It is also associated with a higher risk of cardiovascular diseases such as coronary artery disease, heart failure, stroke, and even cardiovascular death.9–15 Few studies have explored this concept and most studies have excluded this group or have merged it with the normal weight category during the analysis of data.16,17 In addition, certain studies have shown that being underweight increased cardiovascular risk in the elderly and female populations.18 This study aims to compare underweight and normal weight central obesity groups and possible age and gender differences in association with cardiovascular risk and diseases using a previous local study, which showed that participants with normal BMI and increased waist circumference and or waist-to-hip ratio is a common finding among Filipinos and is associated with greater cardiovascular risk among other classifications of obesity.19
Objectives
The objectives of the study were to determine the:
- clinical characteristics of underweight versus normal-weight central obesity among Filipinos;
- association of sex with cardiovascular risk and diseases among underweight Filipinos; and
- association of age with cardiovascular risk and diseases among underweight versus normal-weight central obesity among Filipinos.
Methods
We conducted a cross-sectional study using data from the National Nutrition and Health Survey 2008 (NNHeS II) obtained from The Department of Science and Technology- Food and Nutrition Research Institute (DOST-FNRI). The NNHeS II employed stratified multistage sampling that covered the entire Philippines population of adults aged 20 years or older. Sampling was performed at the barangay/community, enumeration area, and household levels of the 17 regions of the country. The population that represented the whole country was generated by sampling 25% of those households. The data requested were measures of blood pressure; anthropometrics of height, weight, waist circumference, waist–height ratio and BMI; and medical information on cardiovascular risk and diseases of hypertension, diabetes, dyslipidaemia, coronary artery disease, cerebrovascular disease, and peripheral artery disease. Participants with these complete data were categorised and analysed. This study was approved by the DOST-FNRI and the Institutional Ethical Review Board of the Philippine Heart Center. A detailed description of the survey design and procedures was published in 2012.20
Operational Definitions
The operational definitions used in the study are as follows.19,20
BMI: Weight in kilograms divided by the square of the height in meters. Categories: underweight (<18.5kg/m2), normal (18.5–24.9 kg/m2), overweight (25–29.9 kg/m2) and obese (≥30 kg/m2).
Hypertension: Systolic BP (SBP) ≥140 mmHg, diastolic BP (DBP) ≥90 mmHg using the mean of three measurements during a single visit, a previous diagnosis of hypertension, or use of antihypertensive medication.
Diabetes: Fasting plasma glucose level ≥7.0 mmol/l (126 mg/dl), or a history of diabetes, with or without the use of oral antihyperglycaemic medication or insulin.
Dyslipidaemia: Any abnormalities from the lipid profile as high total cholesterol ≥6.20mmol/L (240 mg/dl), high LDL-C ≥4.14 mmol/l (160 mg/dl), high TG ≥2.26 mmol/l (200 mg/dl), low HDL-C ≤1.03 mmol/l (40 mg/dl) with or without the use of anti-dyslipidaemia medications.
Coronary artery disease (CAD): Previous heart attack, documented ischaemia or coronary artery occlusive disease diagnosed by a medical doctor or nurse at the time of survey.
Cerebrovascular accident (CVA): Previous stroke or transient ischaemic attack diagnosed by a medical doctor or nurse at the time of survey.
Peripheral artery disease (PAD): Previously diagnosed occlusive disease by a medical doctor or nurse at the time of survey.
Waist circumference: Measured at the midpoint between the lowest rib and the iliac crest by a field worker with comprehensive training.
Hip circumference: Measured at the greater trochanter or widest diameter of the hips by a field worker with comprehensive training.
Central obesity: Waist–hip ratio (WHR) ≥0.85 female, ≥0.90 male or waist circumference (WC) ≥80 female and ≥90 male.
Cardiovascular risk: Hypertension, diabetes, and dyslipidaemia.
Cardiovascular disease: Coronary artery disease, cerebrovascular disease and peripheral artery disease.
Age groups: Younger (20–42 years), middle (43–54 years), and older (55–88 years) based on 25th, 50th and 75th percentiles of participants.
Smoking: Practice of burning tobacco and ingesting the smoke.
Data Organisation, Editing, Processing and Analysis
The data obtained were checked for completeness using Microsoft Excel (version 16.30): 1. underweight; 2. normal weight central obesity (NWCO). Rechecking of data was performed twice to ensure correctness and validity.
Statistical Analysis
All analyses were performed using Statistical Package for the Social Sciences (version 20) and MedCalc (version 10). Univariate analysis includes Mann–Whitney U-test for continuous variables and chi-square for categorical outcomes. Binary logistic regression using the forward technique was used to determine significant correlates for each risk factor/cardiovascular outcome. Odds ratios above 1, with p values less than 0.05 indicated an association with the outcome. Adjustment for potential confounding variables (age-sex) was done using the Mantel-Haenszel test. Age was reclassified into three percentiles (P) 25th, 50th and 75th. Mean differences were determined using independent t-test between categories. Precision estimates were pegged at 95% confidence level.
Results
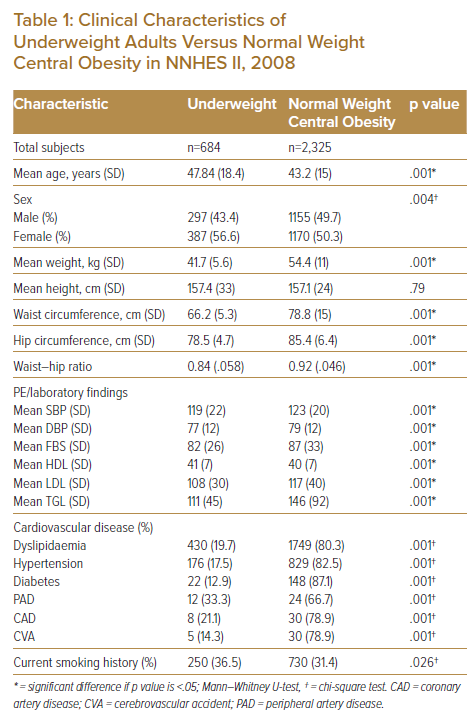
A total of 684 adults (22.7%) were classified underweight based on BMI criteria while 2,325 (77.3%) were classified normal weight central obesity. The age range for this study was 20–88 years. The age range was 20–83 years (mean 47.8 ± 18) for the underweight category, and 20–88 years (mean 43 ± 15) for normal-weight central obesity.
Significant differences in age and sex distribution were noted. Underweight adults were slightly older (mean 47.8 years versus 43.2, p=.001) than those with normal weight central obesity. More females were underweight than males (56.6% versus 43.4%, p=.004). Significant differences were noted in terms of mean weight, waist circumference, hip circumference, and waist–hip ratio (all p<.05), all higher among participants classified normal weight central obesity (Table 1).
Systolic and diastolic blood pressure levels, FBS, and lipid fractions were significantly lower among the underweight category (all p<.05).
Participants in the normal weight central obesity category were associated with a higher percentage of cardiovascular risk such as dyslipidaemia (80.3% versus 19.7%), hypertension (82.5% versus 17.5%), diabetes (87.1% versus 12.9%), peripheral artery disease (66.7% versus 33.3%), coronary artery disease (78.9% versus 21.2%) and cerebrovascular accidents (78.9% versus 14.3%) compared to those in the underweight category (all p<.05).
Smoking history was statistically higher in the underweight category (36.5% versus 31.3%, p=.026).
Association of Underweight with Cardiovascular Risk and Disease Conditions
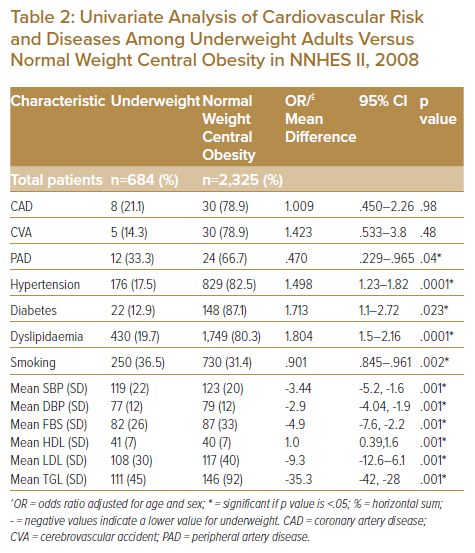
After adjusting for age and sex, univariate analyses revealed a higher probability of underweight adults to have hypertension (OR 1.498; 95% CI [1.23–1.82], p=.001), diabetes (OR 1.71; 95% CI [1.1–2.72], p=.023) and dyslipidaemia (OR 1.8; 95% CI [1.5–2.16], p=.0001).
Underweight adults had significantly lower odds of peripheral artery disease (OR 0.47; 95% CI [0.22–0.96], p=.04) compared to their counterparts with normal weight central obesity after adjusting for age and sex (Table 2).
Underweight adults had significantly lower mean differences in systolic and diastolic pressure and laboratory parameters, such as fasting blood sugar, LDL, and triglycerides but slightly higher HDL levels (all p<.05).
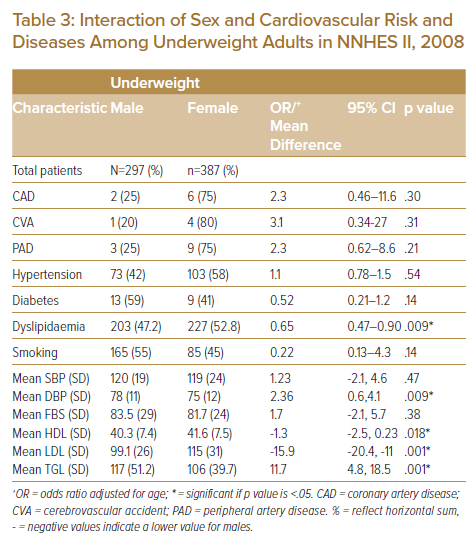
Sex-Stratified Analysis of Cardiovascular Risk Factors among Underweight Adults
When compared to their female counterparts, underweight males had a significantly higher mean diastolic BP (78 versus 75, p=.009); triglycerides level (117 versus 106, p=.001) and lower mean HDL values (40.3 versus 41.6, p=.018).
Underweight females had significantly higher mean levels of LDL (15 versus 99, p=.001) (Table 3).
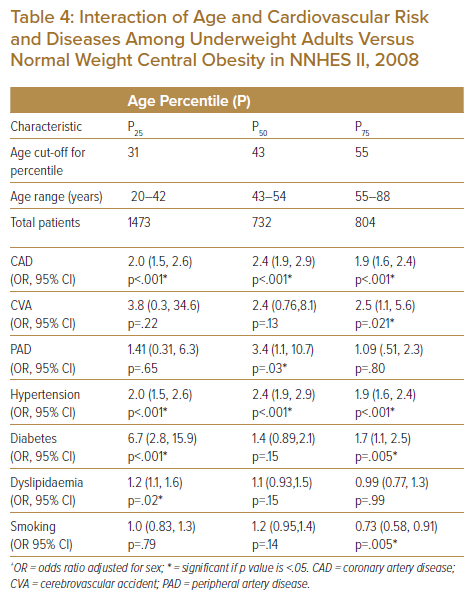
Age-Stratified Analysis of Cardiovascular Risk Factors among Underweight and Normal Weight Central Obesity
Using the 25th, 50th and 75th percentiles cut-off for age, underweight adults showed a higher likelihood of coronary artery disease in all age categories (43 years), (OR 2.4; 95% CI [1.9,2.9], p<.001), younger population (25th percentile or 31 years) and the 75th percentile (55 years). Cerebrovascular accident odds were highest in the 75th percentile (OR 2.5; 95% CI [1.1,5.6], p=.021), while peripheral artery disease was highest in the 50th percentile for age (OR 3.4; 95% CI [1.1,10.7], p=.03). Hypertension risk was seen in all three age categories but was highest in the median age (OR 2.4,95% CI [1.9,2.9], p<.001). Diabetes risk was highest in younger underweight adults (OR 6.7,95% CI [2.8,15.9], p<.001), followed by those aged 55 years (OR 1.7,95% CI [1.1,2.5], p=.005). The odds of smoking were lowest in the 75th age percentile (Table 4).
Discussion
A total of 3,009 participants were included in the study; 684 (22.7%) were classified underweight while 2,325 (77.3%) were classified normal weight central obesity. In a local study using the same participants, underweight accounted for a minority (11.6%). This percentage is comparable to epidemiological studies in other Asian countries such as China (8.55%) and Japan (15%) and higher compared to the USA (1.9%) and European countries (2%).21,22 However, it is still underrepresented compared to other BMI categories in most epidemiological studies. Underweight participants were older compared to normal weight central obesity with a mean age of (47.8 versus 43.2 years); ageing and loss of weight may go hand in hand.23 Underweight is more prevalent among females than males and may be due to known gender differences in genetics, dietary habits, and cultural preferences.24 Cardiovascular risks and diseases such as dyslipidaemia, hypertension, diabetes mellitus, peripheral artery disease, coronary artery disease, and cerebrovascular accidents were more prevalent in normal weight central obesity versus underweight due to a greater portion of the population in the former.23 However, smoking history was higher among participants in the underweight category, which may be an effect of increased energy expenditure and reduced appetite from tobacco use.25
Using adjustment models for age and sex, participants in the underweight category had a higher risk of hypertension, diabetes, and dyslipidaemia compared to normal weight central obesity. While few studies have compared underweight and normal weight central obesity cardiovascular risk and diseases a large retrospective study in China using incidence, age, and sex-adjusted models showed that underweight participants had higher cardiovascular risk compared to normal weight.13 Cardiometabolic physiology such as malnutrition and chronic illness were attributed to the association.26–28 In a study among chronic kidney disease patients on dialysis, underweight patients had a higher association of hypertension than patients in greater BMI groups. It was speculated to be an effect of increased pro-inflammatory, anti-endothelial, and sympathetic activity among this subset of patients.6 The higher association of diabetes mellitus in underweight than in normal weight patients was also established in a large prospective cohort among adult Japanese patients. Although the mechanism is uncertain, the hypotheses were protein-calorie malnutrition, magnesium deficiency, and low serum albumin levels.29 In a case-control study, underweight participants with diabetes had almost three times the risk of dyslipidaemia, higher total cholesterol and LDL, and lower HDL lower compared to diabetics with normal weight.8 For peripheral artery disease, a lower associated risk was seen in underweight compared to normal-weight central obesity participants, though the theoretical explanation is difficult to ascertain. Supporting evidence of this association were also seen in a prospective community-based cohort called the ARIC study which comprised of 0.8% participants in the underweight category. It demonstrated that a higher BMI and central obesity were positively associated with the incidence of hospitalised peripheral artery disease.30 In addition, a retrospective study in Japan showed a significantly higher incidence of all-cause mortality among peripheral artery disease patients whose ABI was less than 0.9 or who had received revascularisation therapy of the lower limbs in patients with BMI >18.5.31 The discrepancies were seen in the positive association of cardiovascular risk and significantly lower mean differences in the systolic and diastolic pressures, laboratory parameters such as fasting blood sugar, LDL and triglycerides, and slightly higher HDL levels may be confounded by factors such as use or potency of medications maintained by the participants and may represent the chronic process seen in the underweight group.
Underweight males tend to have higher mean diastolic BP compared to females. This pattern is usually seen in middle age, the fundamental haemodynamic fault increases systemic vascular resistance with an inappropriately normal cardiac output.3 Gender differences in dyslipidaemia among underweight participants showed that males have higher TAG and lower HDL values compared to females while females have higher LDL values compared to males. Triglycerides tend to vary inversely with HDL while LDL tends to rise in post-menopausal females.3 Other factors such as diet, presence of diabetes, and genetic factors also come into play.32,33
In the age-stratified model, coronary artery disease and hypertension were higher in all age groups, stroke in the middle age group, diabetes in the younger and older age groups, dyslipidaemia in the younger age group, and peripheral artery disease in the middle age group among the underweight compared to normal weight central obesity. These findings were also seen in a large cross-sectional study in US adults; the risks of hypertension, diabetes, dyslipidaemia, stroke, heart attack, and angina were significantly higher in the underweight than in the normal weight control group.14 In an analysis of each cardiovascular disease, being underweight was the strongest independent risk factor for stroke, heart attack/myocardial infarction (MI), and angina/coronary artery disease compared to higher BMI.13 Also, in the largest meta-analysis of observational studies, being underweight was associated with the highest risk of short- term and long-term mortality while overweight and obesity were both associated with lower risk.9,34 Possible explanations are that underweight patients may have an underlying genetic predisposition to coronary artery disease and worse prognoses are associated with more severe, extensive coronary disease and a delayed diagnosis due to low suspicion in underweights compared to normal and overweight patients.35–37
The obesity paradox challenges our contemporary understanding that cardiovascular morbidity and mortality are largely driven by excess body weight and fat. The current data from the large cross-sectional, retrospective and prospective studies also found an inverse correlation between BMI and mortality.38,39 Likewise a retrospective local study also demonstrated that NWCO was associated with greater cardiovascular risks when compared to obese and overweight with or without central obesity.18
Limitations and Recommendation
There are several limitations to this study. First, it is a cross-sectional retrospective study using data from 2008. A prospective randomised controlled study with long-term follow-up is necessary to determine a robust causation and survival benefit of an ideal BMI and to establish if the cardiovascular risks and diseases seen in underweight subjects will translate to cardiovascular mortality. Until then it is modest to attain a normal weight without central obesity through proper diet and exercise and to discourage underweight and normal-weight central obesity as well. Second, the event rates of cardiovascular disease, such as CAD, CVA, and PAD were low; a similar number between the two groups and a larger sample size would be ideal for comparison. Third, the category of a participant was based on a certain point and may have varied with time; these possible changes were not accounted for. Fourth, an operational definition using the Asian BMI cut-off would have increased the prevalence of underweight and NWCO and may be used in reporting for our national survey. Finally, there are other imaging modalities to accurately identify the amount of visceral fat and lean muscle mass of a participant such as dual-energy X-ray absorptiometry. However, this is not feasible for mass screening and our lack of resources.
Conclusion
Study participants in the underweight category were more likely to be older and female. There was also a gender difference in the patterns of dyslipidaemia and diastolic blood pressure. Among underweight participants, a greater association of hypertension and coronary artery disease in all age groups, stroke among the older age group, and diabetes among the younger and older age groups were seen compared to normal weight central obesity in Filipinos.
Clinical Perspective
- Being underweight is more prevalent among Asian and developing countries, such as the Philippines.
- An obesity paradox exists due to increased visceral fat obesity and lower lean mass among Filipinos.
- In comparison to normal weight central obesity, an underweight person carries a higher association with cardiovascular risks and diseases.