


Echocardiographic measurements of left ventricular mass (LVM) are commonly adjusted for body size by dividing by body surface area (BSA), under the assumption that LVM and BSA scale linearly. This is not the case, however, and allometric indexing has been proposed instead, which assumes an exponential relationship between LVM and body height, the latter raised to the allometric exponent b.1 Empirical data from our group and others have indeed shown benefit of allometric over conventional indexing, not only in terms of fitting models to data, but also for predicting clinical outcomes.2–4
While conventional, BSA-indexed values for LVM are referenced against different ranges in males and females, little is known about how between-sex differences should be addressed in allometric analysis. While early papers pooled subjects into a single population, they also analysed males and females separately. Optimal value for b was shown to be higher in male subjects than females, and pooling also typically created a higher value than when each sex was analysed separately.5,6 While earlier reports did not identify this as controversial or even a major finding, later research that placed more emphasis on the role of sex showed that not only did LVM have a relatively flat relationship to height in each sex separately, but the higher value of b obtained after pooling was due to an artificially steep regression line and effectively artefactual.7 Authors stated that the value of b traditionally believed to be optimal at 2.7, as described in earlier research, represented an ‘exaggeration of non-linearity’.5 However, while graphical evidence was provided in a scatter plot, there were no formal supportive analytical data; interaction analysis was performed, which was statistically non-significant (p=0.13).7 It is intuitive that pooling may have this type of effect – changes in regression parameters can sometimes be caused by inappropriate pooling across subgroups in a classic statistical fallacy known as Simpson’s paradox.8,9 However, analytical proof will be required if earlier optimal values of b derived from pooled populations are to be questioned or even rejected (including the traditional allometric exponent described as 2.7).5 We wished to determine whether Simpson’s paradox is indeed present when performing allometric analysis of LVM, and studied this phenomenon in both conventional mixed modelling and Bayesian hierarchical regression analysis.
Methods
Subjects
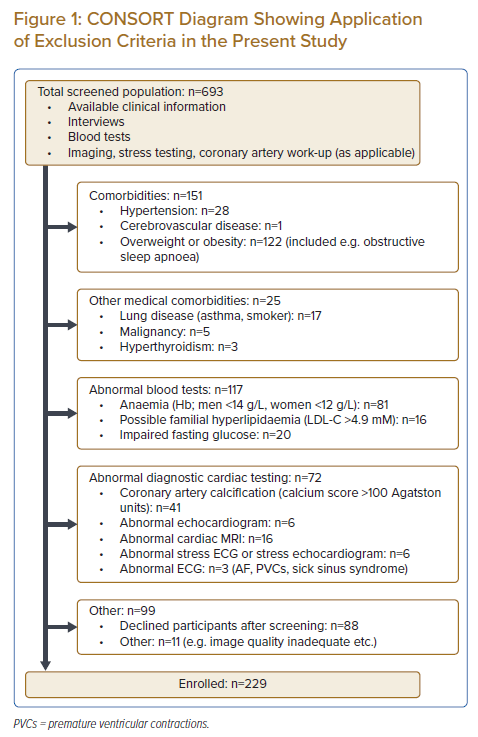
Healthy subjects were identified within an existing cohort of community-dwelling Asians studied earlier by members of our group, which had originally been recruited through advertisements (posters, newspapers, digital media). While the methodology of the ‘parent population’ has been described in detail elsewhere, subjects had undergone a range of very detailed metabolic, molecular and imaging investigations.10 Subjects whose earlier test results were normal underwent a second round of screening by dedicated research coordinators to determine eligibility for the present study, through review of any existing clinical case notes, as well as by interviews. Exclusion criteria included overweight or obesity (BMI ≥25 kg/m2), impaired fasting glucose or diabetes, abnormal ambulatory blood pressure or hypertension, known obstructive sleep apnoea, hyperlipidaemia, coronary calcification on cardiac CT (Agatston score ≥100 units), abnormal cardiac MRI results, any other known medical comorbidity or any other result meaningfully out of the normal range (exclusion process described in detail in Supplementary Methods and also shown in CONSORT diagram Figure 1).11 The present study and its parent cohort were approved by the local Institutional Review Board (CIRB 2017/2465; 2013/605/C) and adhered to the Helsinki Declaration. All subjects gave written informed consent to participation.
Echocardiography
Data in the report represent a subset of a larger effort to establish normal ranges in an Asian population within the framework of an echocardiographic core laboratory tasked with performing academic and industry-sponsored scans. All acquisition and post-processing of images were performed in strict adherence to clinical practice guidelines, including linear LV measurements obtained in the parasternal long-axis view: interventricular septal thickness in diastole, LV end-diastolic diameter, and LV posterior wall thickness in diastole. LVM was subsequently calculated according to the ASE formula as LVM=0.8 {1.04 [(interventricular septal thickness in diastole + LV end-diastolic diameter + LV posterior wall thickness in diastole)3 – LV end-diastolic diameter3]} + 0.6.1 Details regarding equipment, staff and interobserver variability are given in Supplementary Methods.
Allometric Indexing
The allometric equation posits that LV mass is a function of height raised to a power exponent (LVM = a·heightb), where the two unknowns are the coefficient a and the exponent b.12 Analyses presented in this report were performed after logarithmic transformation, which gives rise to the equation of a straight line (log LVM = loga + b·log height). As such, coefficient a is referred to as the intercept in this report and the exponent b as the slope.
Statistical Analysis
The impact of sex was analysed in three principally different approaches. First, a ‘fully pooled’ design was created where all subjects were simply regarded as belonging to a single population, and LVM was regressed on body height. The role of sex was studied by entering an interaction term between sex and height into the model (sex × height). It may be noted that the pooling of subjects is valid if there is no dependency structure within the dataset, as determined through analysis of model residuals. Second, data were also analysed based on an assumption of ‘zero pooling’ between subgroups: treating men and women as two separate populations in separate models, each regressing LVM on height, as done in some earlier articles in this field.5,6 Third, we built two types of ‘partial pooling’ models. First, a mixed model was created using conventional statistics, with a random effect term added for sex both for intercept a and slope b, while determining model fit using restricted maximum likelihood analysis. Second, a hierarchical Bayesian model was created where partial pooling across sex was allowed for intercept a and slope b, as described in detail in Supplementary Methods.13 Analysis of the so-called Bayes factor (BF) was applied to determine the relative credibility of the ‘partially pooled’ model (versus a model with ‘zero pooling’). This can be converted to a decision of which model has better evidence, an approach that has been conceptualised by some as a Bayesian alternative to null hypothesis significance testing performed in conventional statistics, albeit more reflective of how well the model fits the data than the power of the data set.14
Supplementary Analyses Post Hoc
As we have previously emphasised, an arithmetic consideration when indexing the size of an organ to overall body size is that the uncorrected quantity must be a linear function of its indexator with zero intercept.4,15 In other words, the better an indexing exponent is able to explain the dependence of LVM on height, the closer its regression line will pass to the origin of the diagram. We, therefore, performed an appropriateness check post hoc to study the adequacy of the obtained coefficients by regressing LVM on height raised to the power in question and subsequently plotting the regression line. Exploratory analyses were also performed post hoc to explore the role of study size for the random effect term for sex in the conventional mixed model; size was augmented with simulated data based on the male:female ratio and covariance matrix of the original sample (refer to Supplementary Methods).
Software
Analyses were performed in R version 3.6.3 (The R Foundation for Statistical Computing). Mixed modelling was performed with the package lmer and Bayesian analyses with rstan. The latter performs posterior probability draws based on Hamiltonian Monte Carlo using so-called No-U-Turn sampling.16 Parameter space was explored using eight chains of 5,000 data points, and standard diagnostic plots were inspected to ensure convergence (refer to Supplementary Methods).
Results
Baseline Characteristics
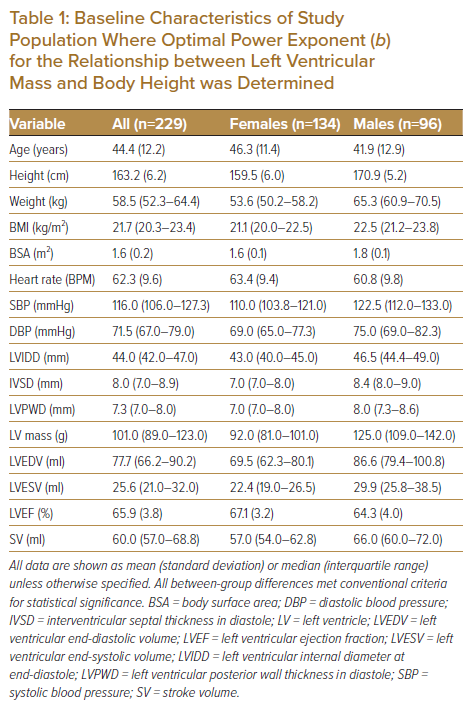
The final study population comprised 229 subjects (age 44.5 ± 12.2 years, range 23–71 years), the baseline characteristics for whom are shown in Table 1, including differences between men (n=96) and women (n=133).
Allometric Exponents and Model Fitting
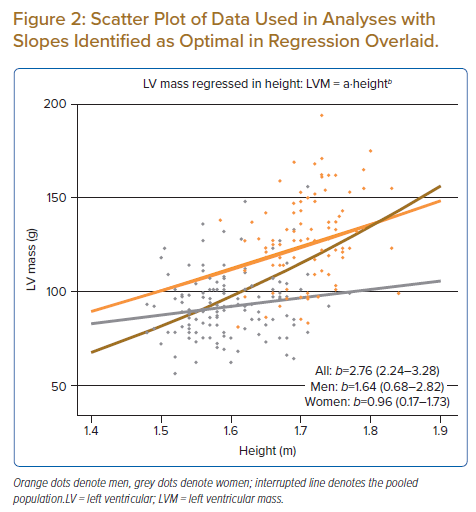
Conventional linear regression yielded a pooled estimate for slope (b) of 2.76 (2.24–3.28). Inspection of residuals showed clustering on sex, as evidenced by predominantly positive residuals in men and predominantly negative in women (p<0.001; Supplementary Figure 2). When an interaction term (height × sex) was entered into the linear regression model, however, it did not reach conventional limits for statistical significance.
In the mixed model, b had a fixed effect term of 1.41 (0.12–2.71), with a random effect term of ±0.58, leading to final estimates for b in men and women of 1.99 and 0.84, respectively. While the random effect specified for intercept a was highly statistically significant, the random effect term for slope b did not meet the conventional criteria for statistical significance (see simulation below).
The ‘partially pooled’ Bayesian model identified optimal b in men as 1.64 (0.68–2.82) and in women as 0.96 (0.17–1.73). The Bayesian model with ‘zero pooling’ (i.e. where separate regression lines were fitted for subgroups) identified estimates for b as optimal in men of 1.95 (0.75–3.15) and in women of 0.82 (0.02–1.65). Model comparison based on BF showed greater credibility of the model parameterised with partial pooling versus that with zero pooling (BF >3.0). Figure 2 shows a scatter plot of the raw data points used in the analysis with slopes overlaid based on estimates obtained for a and b in the partially pooled model, Supplementary Figure 3 shows parameter estimates of the posterior draw, and Supplementary Figure 4 shows a representative diagnostic trace plot of burn-in and sampling periods of the eight chains used.
Supplementary analyses post hoc validated estimates obtained in the conventional and Bayesian models by demonstrating that allometric indexing of LVM was able to minimise dependence of LVM on body size in both men and women. (Supplementary Figures 5a–b). The regularisation that occurs in Bayesian analysis and the way this protects against overfitting is also discussed in relation to these validation plots in the Supplement. Finally, exploratory simulation performed post hoc to investigate the role of sample size for model comparisons in conventional statistics showed that approximately 600 subjects would have been required to achieve a p-value for the random effect of slope b <0.05 (Supplementary Figure 6).
Discussion
The present study was designed to explore differences in optimal allometric exponent (b) between men and women, and determine whether it is appropriate to view sex as a clustering variable due to Simpson’s phenomenon. We studied a population of rigorously screened individuals and found that pooling across sex into a single population produced a considerably steeper regression slope and, therefore, a higher value for the allometric exponent b. This was due to a dependency structure within the data set, leading to clustering on sex, giving rise to Simpson’s paradox. When examining how to best parameterise sex using two conceptually different Bayesian models, analysis of BF favoured a clustered design; the view that men and women represent two subgroups within the same model achieved the greatest credibility. This constitutes evidence against indexing men and women using the same allometric exponent, as done in earlier reports where the optimal exponent was derived after pooling men and women, including the widely applied value of 2.7.
Clustering in Allometric Analysis
The present analysis demonstrated that pooling of data from men and women violated the assumption made in regression modelling of independence of observations, as residuals exhibited a clustered pattern (positive in men, negative in women). An exaggerated value for b of 2.75 was seen after pooling, which is virtually identical to the value described in earlier reports.5,7 On the contrary, when subgroups were treated as two separate populations in the zero pooling model and separate regression lines were fitted, optimal values for b in men and women were identified as 1.95 and 0.82, respectively. This confirms the suspicion of Simpson’s paradox first raised in a landmark article by Chirinos et al.7
When we found that the height × sex interaction term was statistically non-significant, we therefore extended the analysis to incorporate multilevel modelling. A clustered model was constructed, which was compared with a zero pooling model where separate regression slopes were fitted for men and women (as done in some earlier reports).5,6 Analysis of BF indicated that the clustered model had greater credibility. This is important for future work in this area, as it provides the analytical evidence of Simpson’s paradox, which was missing in earlier analyses. This indicates that allometric indexing of LVM should take patient sex into account. It adds to questions raised by the aforementioned article by Chirinos et al. about the very steep exponent of 2.7, which has been widely used, but was obtained after pooling men and women into a single population. In fact, not only do our data indicate a difference between men and women, but most published evidence also appears to support the notion that optimal b is higher in men than in women, although this was not seen in all earlier reports.5–7,13,
The use of different exponents in men and women for indexing would not be foreign to routine clinical practice, where LVM is typically indexed to BSA and referenced against sex-specific cut-offs.1 It appears similarly intuitive that different exponents could be applied in men versus women when LVM is indexed allometrically. The relative merits of using sex-specific versus sex-agnostic allometric indexing will need to be studied in future work.
Values of Allometric Exponent b
A key finding of the present study was that levels of LV mass were lower than expected based on body height alone, especially in women. Earlier studies showing a higher optimal value of b have predominantly been performed in white populations, which suggests that race may play a role in our findings.17 However, data from the MESA study found that the optimal allometric coefficient was similar between Chinese and white participants: b=1.63 versus b=1.68.7 Moreover, in an earlier article from our group, we performed the largest analysis to date of optimal b, in a population of healthy, Chinese men (n=1,541; median age 19 years), and found a similar optimal value of b to those in white people in MESA (1.66).4 As such, we do not believe the results of the present study are attributable to race alone.
In the first publication of its kind, De Simone et al. attempted to determine b in 241 adults who had been shown to have normal office blood pressure (BP <140/90 mmHg), and approximately half of whom had also undergone screening with blood sugar testing (although overweight or obese subjects were not excluded). Optimal b identified in their subjects was 2.6 and 2.4, in men and women, respectively.5 While the population was of similar age to our subjects (40–45 ± 12–13 years in their study versus 44 ± 12 years in the present study), significant anthropometric and metabolic differences between populations are likely to make a direct between-study comparison difficult (see below). Lauer later studied subjects in the Framingham Heart Study (FHS), who were recruited after a more comprehensive set of screening investigations, and identified an optimal b of 2.12 and 1.91, in men and women. Interestingly, while their primary study population was capped at a maximum age of 45 years, they removed the ‘age restriction’ in a secondary analysis, and found that optimal b was considerably lower: 1.66 and 1.27, in men and women, respectively (mean age 46.4 and 47.8 years, respectively; cf 41.9 and 46.3 in the present study).6 It may be noted that the value of b identified as optimal in women in their study is well within the 95% credible interval of the mean of our population, which comprised subjects aged up to 71 years. This leads to the question of what role age plays in the relationship between LVM and height, especially in women.
Impact of Age on Optimal b
The exclusion criteria were arguably stricter in the present study than in other published studies in this field. Not only did the protocol eliminate all subjects with occult but manifest cardiovascular disease (Figure 1), but risk factors for disease also led to exclusion. As risk factors are more common with age, it may be speculated that the strict exclusion impacted older subjects more than younger subjects, making them less similar to, for example, patients that undergo echocardiography in clinical practice of similar age. While this is a possibility, it does not represent a distortion or an artefact; normal ranges for clinical practice must be defined using normal subjects. The fact that cardiovascular disease is more common with age illustrates this; there are simply fewer normal subjects remaining in higher age groups. Moreover, members of our group earlier found that sarcopenia is common in community-dwelling, older women. As muscle mass and LV mass were linearly related, the authors speculated that a state of ‘cardio-sarcopenia’ may develop with age in some older women, even in the absence of an actual cardiac disorder.18 This may help to explain why LV mass scaled up more steeply with height in men than women.6 It may also be speculated that if sarcopenia plays a role not only for whole body mass but also for LV mass, this mechanism could be exaggerated by the careful screening performed in the present study, as this would have removed any ‘pathological’ stimulus driving cardiomyocyte growth by, for example, BMI, blood pressure and glycaemic state.
Importance of Screening
We believe that screening is essential for any study that seeks to establish normal ranges. However, the fact that men and women differed in terms of blood pressure – even after extremely careful exclusion of subjects with known hypertension and/or abnormal ambulatory blood pressure measurement (ABPM) – demonstrates how difficult it is to discriminate a perfectly healthy individual from one who is either already suffering from a subclinical medical condition or at elevated risk of developing an overt medical problem. This is important when interpreting the aforementioned study by De Simone et al., as 24% of their subjects had a BMI exceeding the contemporary cut-off for overweight (27.8 and 27.3 kg/m2, in men and women, respectively).5 This raises the important question of how healthy their population really was, especially when considering the fact that the upper limit of the healthy weight range was reduced to 25 kg/m2 in 1995.19,20 Indeed when studying determinants of indexed LVM, calculated using their proposed value for b of 2.7 (i.e. LV mass expressed as g/m2.7), De Simone et al. reported that overweight was an independent predictor. The values for b described in their study were the highest of any report in this field (discussed above), which begs the question of what the impact was of overweight and obesity. Any occult cardiovascular disease introduced by the heavier subjects included will influence the LVM-to-height regression line, which may lead to exaggerated values for b.
Lauer, on the contrary, identified a considerably flatter optimal value of b in subjects enrolled in FHS which, by design, excluded subjects with overt hypertension and overt diabetes. Nonetheless, subsequent research from FHS later demonstrated that prehypertensive subjects in the same cohort were in fact at elevated cardiovascular risk, which in itself suggests that FHS may have had the same difficulty identifying genuinely healthy subjects that we did in the present report.21
The steps taken to exclude underlying medical conditions in the present study were greater than any prior publication in this field. As an example, tests were specifically run to identify and exclude all cases of either impaired glucose tolerance or masked hypertension. This is potentially important, as each of these affects up to one-quarter of the adult population, and neither would have been excluded from any of the earlier populations where optimal b was defined.4–7,22 While individuals with impaired glucose tolerance and masked hypertension are typically asymptomatic, both conditions have been identified as independent predictors of LV remodelling and increased wall thickness.23 Similarly, we excluded all subjects with hyperlipidaemia, a condition recently shown to be a direct cause of LV remodelling and hypertrophy in Mendelian randomisation analysis.24 We interpret the data in the present report as relatively well aligned with earlier reports, and supportive of the notion that the relationship between height and LVM may become steeper the less healthy the population under study is.
Limitations
Several limitations apply to this study. First, as has been described above in detail, owing to the stringent exclusion criteria, the population size was relatively limited. This was illustrated by insufficient power to detect a statistically significant random effect for the slope in the mixed model, and relatively wide credible intervals in Bayesian models (especially for men). However, as this analysis was designed to examine clustering using BF, power was not a key determinant of model fit. Second, while a potential criticism against the present study may be that the population comprised only adults – albeit of a wide age range – the opposite argument can also be made: body size relates to LV size in children in a non-stationary manner, as growth in childhood does not follow rules for static allometry, but ontogenetic.25 This greatly affects the relationship between body size and LV mass in children seen when data are pooled from children and adults into a single population.3,5 We would argue that the correct conclusion from this is that reference ranges for use in paediatric practice should not be based on data from adults and vice versa; any elements of ontogenetic or developmental allometry (as seen in growing subjects) should be avoided when investigating static or steady-state relationships (in adults).
Conclusion
This report extends findings in previous reports by adding formal analytical evidence that Simpson’s phenomenon is present in allometric analysis of LVM due to clustering on sex. Clustering violates assumptions about the independence of observations, and optimal exponents proposed in earlier reports derived after pooling men and women should be viewed critically. We demonstrate that the best approach for addressing the inherent dependency structure within the dataset is a multilevel model that allows for clustering on sex. Finally, the fact that data from men and women should not be pooled into a single population raises the question of whether allometric indexing should be performed using different power exponents in men and women, or the same exponent but sex-specific reference intervals. This issue will require further investigation.
Click here to view Supplementary Material.
Clinical Perspective
- Echocardiographic left ventricular (LV) mass is an important endpoint for therapy and an independent predictor of clinical outcome events. As LV mass does not scale well to body size, allometric indexing has been proposed, where LV mass is reported after first dividing by height raised to a power exponent. The optimal value of the exponent is controversial, however, and whether sex plays a role remains uncertain.
- These results show that the exponent should be determined while taking patient sex into account, leading to important questions regarding earlier reports in this field, some of which have reported a very high exponent after pooling men and women (e.g. the widely used number of 2.7).
- This also indicates that normal ranges for allometrically-indexed LV mass should be applied after taking patient sex into account. This is intuitive and would follow the current standard practice for conventional LV mass where measurements are referenced against sex-specific cut-offs.