We have witnessed remarkable advances in cardiovascular therapeutics over recent decades, yet adverse outcomes related to cardiovascular diseases (CVD) are on the rise.1 CVD accounts for one-third of global mortality, being the cause of death of 17.9 million people in 2015.2 Pathophysiological factors underlying CVD onset and progression are complex. There are multiple contributing risk factors – physical activity, smoking status, obesity, diabetes and lipid status – which are partially modifiable and, therefore, can be explored to motivate behavioural changes in patients, including lifestyle changes, such as smoking cessation, dietary change and increased physical activity and disease management. In the vast majority of cases, the onset and progression of atherosclerotic CVD can be prevented or better managed.3,4
At present, several risk scores exist, including the Framingham Risk Score, Thrombolysis in MI (TIMI) score and QRISK.5–8 These risk scores have been instrumental in improving the quality of cardiovascular care; however, they often do not incorporate the effect of time-varying interventions or repeated measurements over time.
With the advent of electronic health records (EHR) and availability of real-world clinical data, machine-learning (ML) and deep-learning models are increasingly being used to develop risk predictions that can better identify physiological patterns and disease progression. However, it is often difficult to adequately distinguish between association and causation in these models.9–11
Clinical comprehension of the underlying pathophysiology and the role of different risk factors are essential for designing effective treatment strategies. In this paper, we present a novel approach which adopts ML components to mimic a causal biological framework to predict for 1 year and 2 year recurrent major adverse cardiovascular events (MACE) risk among patients recovering from MI in the inpatient setting. Salient features include personalised CV risk prediction, the effect of dynamically changing clinical interventions, and conduct in an Asian population.
Methods
Data Source
This was a retrospective observational cohort analysis based on SingCLOUD EHR data in a real-world setting.12 SingCLOUD captures anonymised cardiovascular patient-level data from the five public hospitals and 18 primary care clinics that provide approximately 80% of healthcare nationwide in Singapore. It includes longitudinal information on demographic, administrative, diagnostic, laboratory, procedural and prescription data. Patients are tracked via a national registration identity card (NRIC) number, which is used throughout Singapore’s public healthcare institutions and serves as a means of patient identification across all electronic medical record systems in Singapore.12 In 2014, SingCLOUD held information on 53,395 patients.
Study Period
The study period was from January 2011 to December 2014. A baseline of 6 months prior to and including index date was used to assess demographic details, lifestyle factors, comorbidities and medications. Patients were followed for up to 2 years from index date or December 2014, whichever was earlier.
Index Date
The index date was defined as the date of discharge after primary MI and assumed to be 2 weeks after hospital admission since discharge date is not documented for all patients in SingCLOUD.
Participants
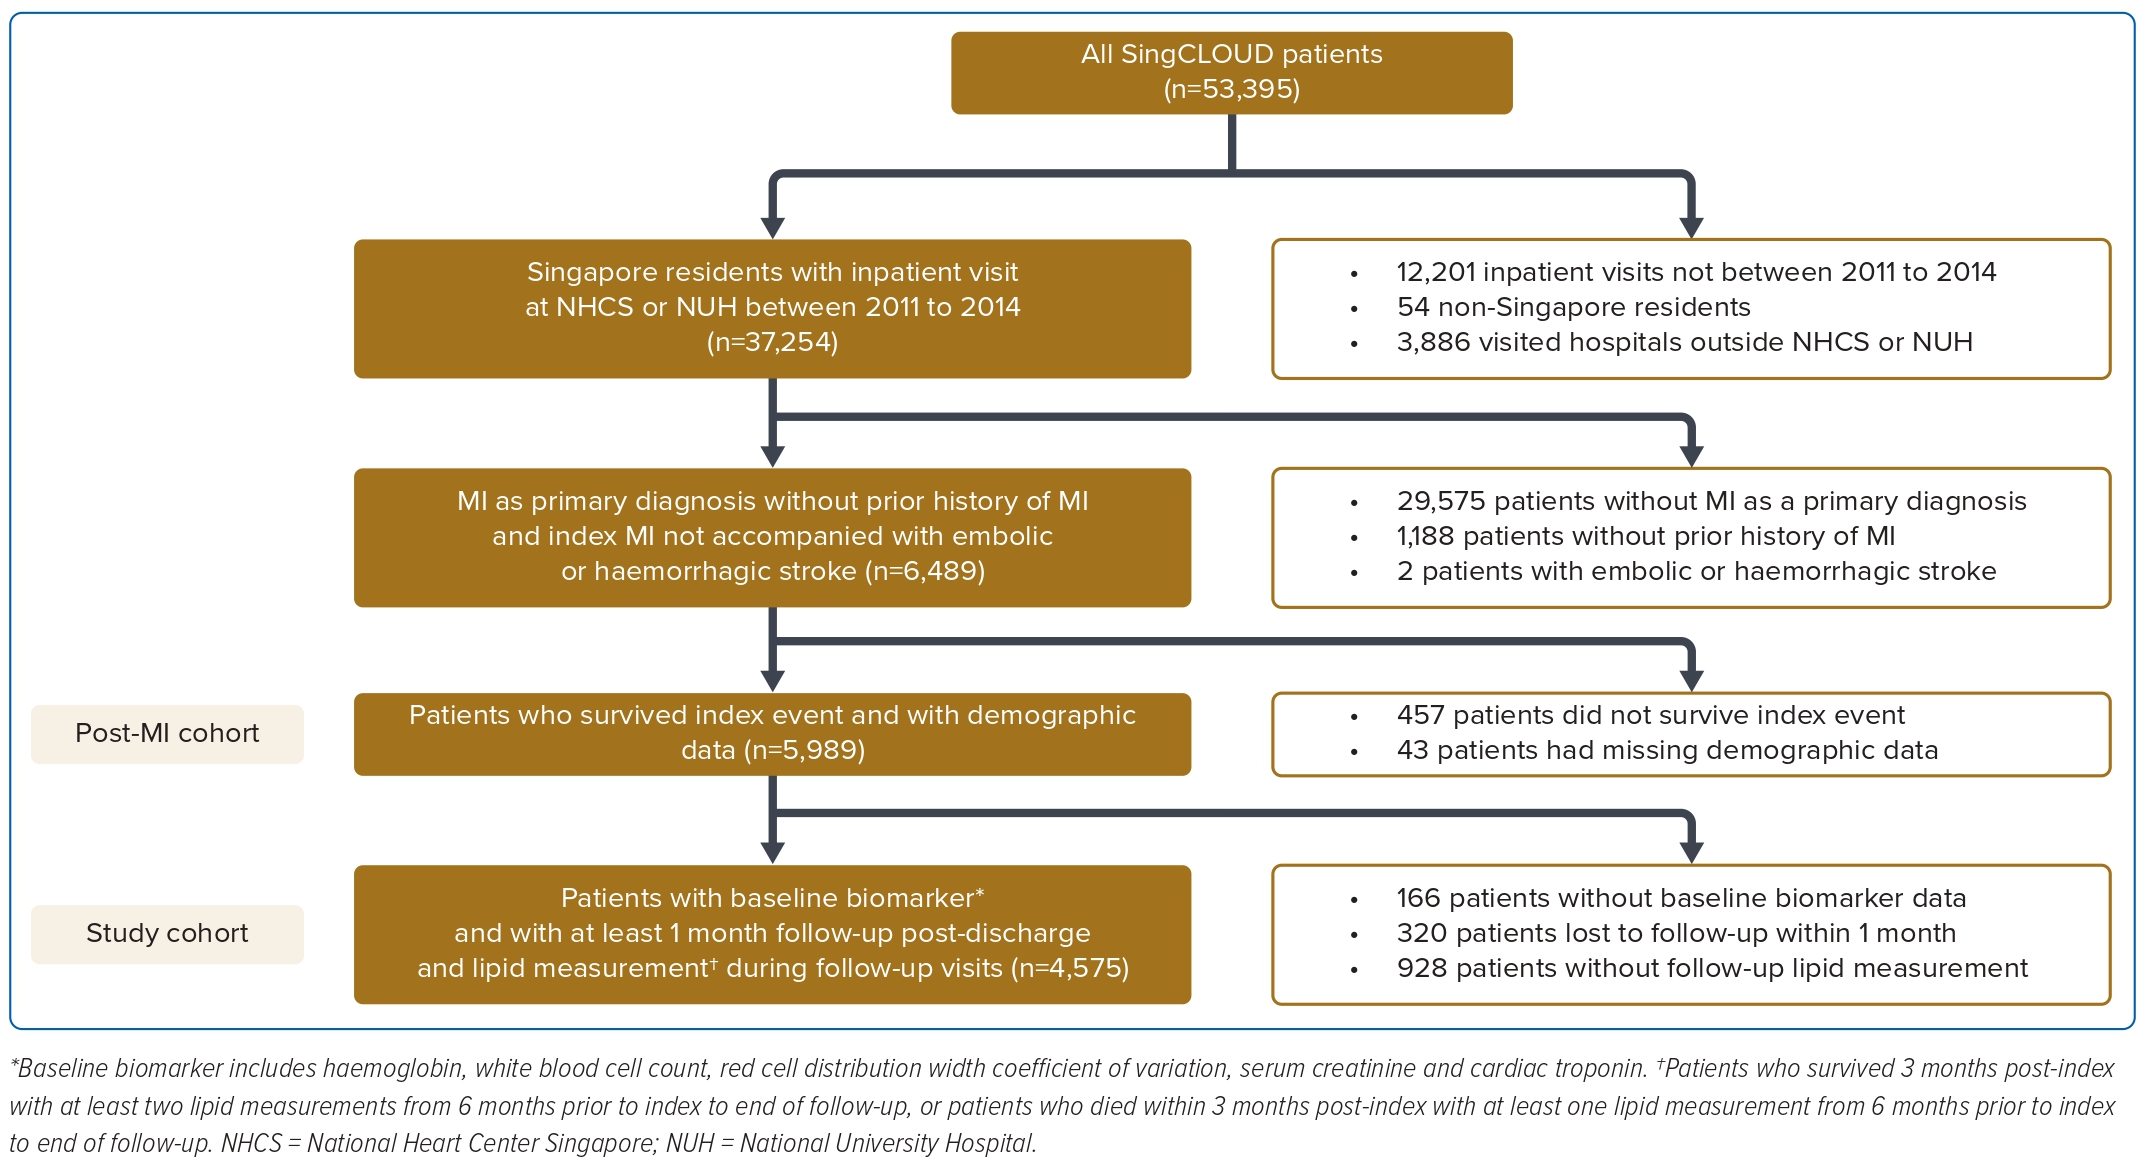
The study population includes patients who were admitted to the National Heart Center, Singapore or the National University Hospital, Singapore between 2011 and 2014 with a primary diagnosis of MI with a minimum follow-up period of 1 month required as the time resolution used in loss function optimisation. Patients with any of the following were excluded from the analysis: index event preceded 2011; index event was accompanied by embolic or haemorrhagic stroke during index hospitalisation; death within 2 weeks post-index MI event; had missing details of age or sex; or aged ≥99 years old (Figure 1). The post-MI cohort was n=5,989.
Dynamic model development incorporated inputs from baseline and post-discharge data, including haematology, chemistry and lipid panels. Patients from the post-MI cohort were excluded from analysis if:
- Haemoglobin, white blood cells (WBC), red cell distribution width coefficient of variation (RDW-CV), serum creatinine, or cardiac troponin I or T-values were missing at baseline.
- They were lost to follow-up in the first month post-index discharge.
- They were without at least one lipid measurement in baseline period if they had died within 3 months post-index.
- At least two lipid measurements from baseline to end of follow-up, and one of which is during follow-up, were missing if they survived beyond 3 months post-index.
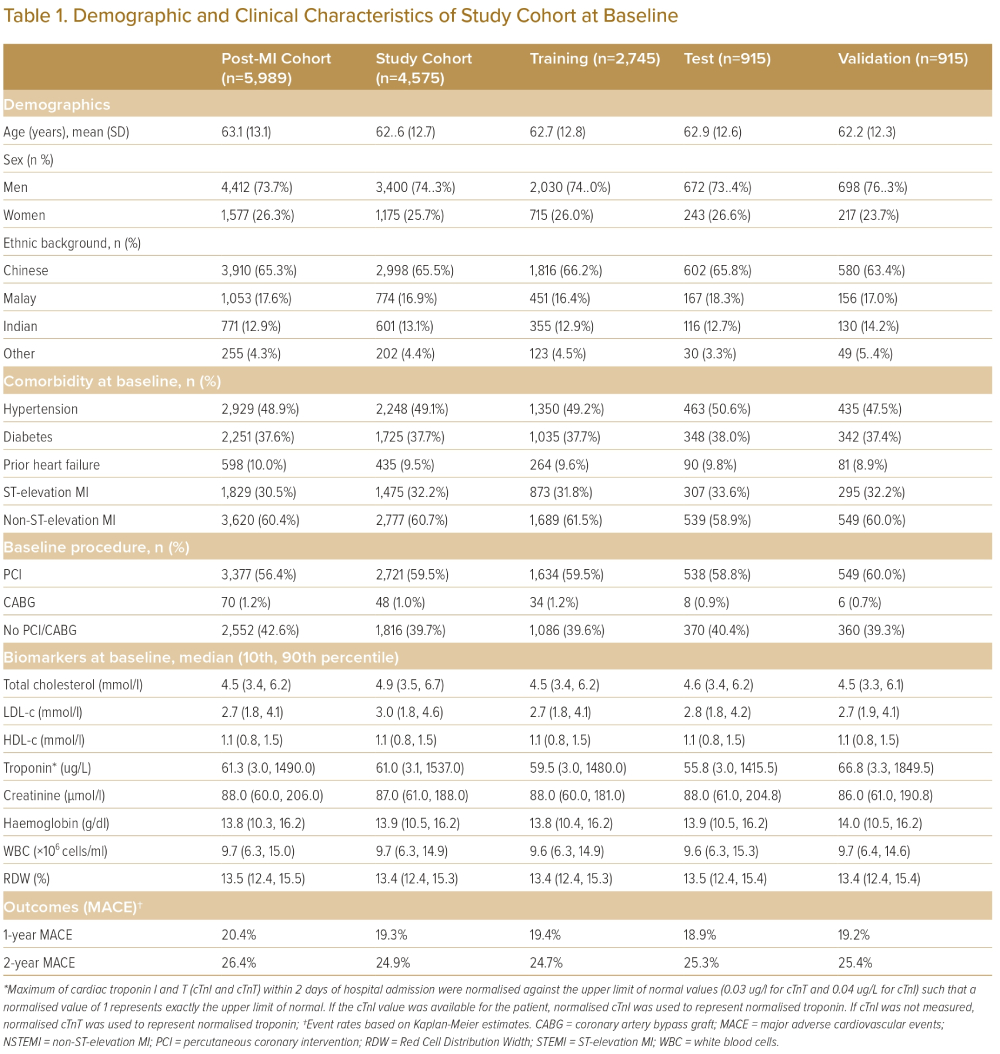
This left a study cohort of n=4,575 (Figure 1). Potential selection bias due to non-random absence of post-discharge data was investigated by comparing patient characteristics of the post-MI cohort and study cohort (Table 1 and Supplementary Material Table 1); differences in patient characteristics between these two cohorts were expressed in terms of p-value and Cohen’s d.
Outcomes
The primary outcome was the composite endpoint of MACE, which includes recurrent MI, stroke, onset of heart failure (HF) and cardiovascular mortality up to 2 years after index date and modelled as dichotomous outcome. MACE outcomes were extracted from SingCLOUD based on International Classification of Diseases (ICD)-9, ICD-10, and SNOMED codes.
Sample Size
The overall study cohort (n=4,575) was divided on patient level into training (n=2,745), validation (n=915) and test dataset (n=915). Stratified random sampling was performed with MACE event rates as stratification factors. Model development was performed on the training dataset, model hyperparameters tuning was performed on the validation dataset, and the test dataset was reserved exclusively as hold-out for reporting operating characteristics. The sampling ratio was determined so that the validation and test dataset could individually satisfy the sample size requirement; the minimum sample size was estimated to be 911, assuming a predetermined sensitivity of 0.8 and specificity of 0.8, and the prevalence of 2-year MACE event of 27% with 95% confidence level and 5% maximal margin of error (half width of CI).13
Predictors
Putative predictors included:
- Baseline demographics – age (years), sex.
- Medical history – hypertension, diabetes, heart failure.
- Prior prescriptions – statins, angiotensin-converting enzyme (ACE) inhibitors, angiotensin II receptor blockers (ARBs), calcium channel blockers, loop diuretics, β-blockers.
- Baseline lipid measurement within 6 months prior to index date.
- Other baseline biomarker – serum creatinine, WBC, haemoglobin, RDW-CV – measurement within 3 months prior to index date.
- Peak cardiac troponin ± 1 day around index hospital admission.
- Diagnosis of MI at index admission – ST-segment elevation MI (STEMI) or non-STEMI (NSTEMI).
- Baseline procedures – percutaneous coronary intervention (PCI), coronary artery bypass grafting (CABG), number of stents – within 2 weeks from index admission.
- Prescription at discharge from index hospitalisation – aspirin and adenosine diphosphate (ADP) receptor inhibitors.
- Estimated medication adherence over time based on post-discharge prescriptions records – ACE inhibitors, ARBs, calcium channel blockers, loop diuretics, β-blockers, aspirin and ADP receptor inhibitors.
- Estimated continuous lipid trajectory based on follow-up lipid measurements – total cholesterol, low-density lipoproteins (LDL) – and statin prescriptions.
- Estimated continuous trajectory of estimated glomerular filtration rate (eGFR) using the Chronic Kidney Disease Epidemiology Collaboration (CKD-EPI) equation over time based on serum creatinine records post-discharge (Supplementary Material Method). In particular, a pharmacodynamic model that incorporates efficacy of lipid-lowering therapy was developed to generate continuous lipid trajectories which were then used as time-varying model inputs (Supplementary Material Method).
In the real world, longitudinal data, such as biomarkers and medications, were rarely collected frequently or regularly and were often accompanied by a high degree of missing data. We addressed these challenges by making the following simplifying assumptions and strategies: causal pharmacodynamic models and optimisation techniques (for lipids via lipid simulation), linear interpolation (for eGFR measurement), and assuming some missing values can be replaced by the most recent present value (last observation carried forward used for estimating adherence).
Medication adherence was used as an input to both lipid simulation and the dynamic models. Drug class-specific adherences, such as statin, ACE inhibitors, ARBs, β-blockers, calcium channel blockers, loop diuretics, aspirin and ADP receptor inhibitors, were calculated as total prescribed days normalised by number of days between current and next refill.

where:
adherencen,i | Drug-family specific adherence for nth refill prescription (%) |
Refilln,i,start | Start date of nth refill prescription of individual drug family |
Refilln,i,end | End date of nth refill prescription of individual drug family |
Refilln+1,i,start | Start date of (n+1)th refill prescription of individual drug family |
| n | nth refill prescription |
| i | ith drug family |
In the case of overlapping prescriptions between sequential visits, the subsequent prescription was shifted to the later starting date – maximal adherence = 1 – while maintaining the overall duration of the prescription.
Patient-specific lipid trajectories were generated using a pharmacodynamic model by incorporating pharmacokinetic information.14–16 The lipid simulations calculated changes in lipid level in response to effects of different lipid-lowering drugs via neural networks-based simulation incorporating parameters including IC50 (half maximal inhibitory concentration), Imax (maximum systematic plasma concentration) and prescription adherence. The lipid simulation estimated patient-specific increases in cumulative risk burden due to abstinence from statins (Supplementary Material Methods and Supplementary Material Figure 1). The optimised trajectories of total cholesterol and LDL were then used as time-varying inputs to the dynamic model – continuous trajectory of LDL and very-low-density lipoprotein (VLDL) + intermediate-density lipoprotein (IDL) as estimated from total LDL and high-density lipoprotein (HDL) cholesterol.
Model Development
The static ML models were developed using baseline information (demographics, medical history, MI diagnosis, baseline biomarkers, prescriptions and procedures) (Supplementary Material Table 2) to predict a patient’s recurrent MACE risk for 1 and 2 years. Four standard ML classification algorithms, including logistic regression (with and without ridge regularisation), random forest and XGBoost, were developed from the training dataset (n=2,745).17–20
In contrast to static ML models, the dynamic model not only ingests data from the baseline, it also takes into account longitudinal information from post-discharge follow-up visits. The dynamic model was constructed and customised based on a causal biological framework (Supplementary Material Figures 2 and 3) to predict MACE risk as a function of time-varying risk factors. It incorporated both baseline and follow-up information, enabling discrimination of immediate, short-term risk factors from progressive, long-term risk factors in a single model. The total cumulative risk burden was the sum of the immediate risk components R1, and progressive risk components R2.
R = R1 + R2
The short-term risk component R1 evolved in the time immediately following index MI, which is a function of the patient’s medical history, baseline biomarkers, index event treatment and discharge prescriptions.
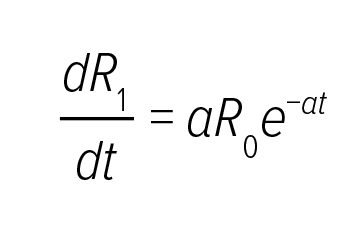
R2 represented gradual progression of atherosclerosis with given disease management with contributions from prior comorbidities, such as renal dysfunction and heart failure, and disease management, such as
follow-up medications and adherence.
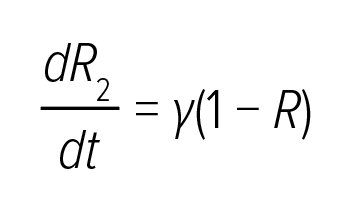
In this equation, γ was a function of both time-invariant features, such as prior diagnosis, and longitudinal measurements, such as changes in biomarkers during follow-up and patients’ medication adherence, enabling continuous risk adjustment through the EHR. If γ (the growth rate of the long-term risk component R2) is limited, the cumulative risk R2 remains relatively constant. Besides, patients with a higher risk burden tend to deteriorate faster; therefore, the instantaneous risk R also contributed to the rate of risk progression – the positive feedback including itself as an input to γ). Each model component R0, a, γ, was represented by a neural network architecture (Supplementary Material Table 3); and boundary conditions are R1 (t = 0) = 0 and R2 (t = 0) = 0 and. The rationale behind predictor selection and construction of a model framework are discussed in the Supplementary Method.
Model training is the development phase where the values of weights of the embedded neural networks are calculated by minimising a suitably defined loss function as described below.
In this equation, yi refers to the outcome variable of patient i (a value of 1 indicates that the patient had a MACE event); tn which indicates the time of patient’s endpoint, and pi,tn is the estimated risk score of patient i at time tn; w0 and w1 are the weights applied to balance the positive and negative cases.
Model Validation
Validation analysis was performed to assess accuracy and robustness of the predictions on the test dataset (n=915), which were reserved as hold-out solely for reporting operating characteristics. Model performances were evaluated by area under the receiver-operator curve (AUROC), sensitivity, specificity, positive predictive value (PPV) and negative predictive value (NPV) at different time points (6, 12, 18 and 24 months post-index date) with 95% CI.21 When evaluating the static model or benchmark, performance metrics were assessed on all patients in the hold-out dataset from index discharge; however, performance of the dynamic model was assessed on patients who had not yet experienced recurrent MACE events by the start of the prediction window.
Feature Importance
The importance of various predictors was assessed using the permutation feature importance method. Briefly, it calculated the decrease in model performance when a particular predictor was randomly shuffled across the board as compared to the performance without shuffling. For each predictor, its importance was estimated from the average of 50 individual runs of permutation feature importance. The lipid panel (LDL, HDL and total cholesterol) were shuffled collectively as a single feature.
Threshold Determination
The model generated continuous cumulative risk trajectories for individual patients; we adopted a cost-agnostic approach to numerically derive the threshold based on the point on the AUROC, curve which maximised Youden’s J statistic on the validation dataset at 3, 6, 9, and 12 months post-index date.
J = sensitivity + specificity − 1
Comparison with Existing Risk Stratification Scores
We compared the model’s performance with published risk scores (TRA 2oP-TIMI 50) among post-MI patients.6 The performance of the TRA 2oP-TIMI 50 risk score in the study cohort was evaluated using the AUROC score of cumulative events at 1 and 2 years. Smoking status is a required input covariate for TRA 2oP-TIMI 50 risk score database, but that information is not available in SingCLOUD, so an assumption that all patients were non-smokers was made and additional sensitivity analyses with different assumptions about smoking on TRA 2oP-TIMI 50 risk score were performed.
Results
Patient Characteristics
The patient attrition flowchart is shown in Figure 1 and patients’ demographic and clinical characteristics at baseline are described in Table 1. The test and validation datasets were largely similar to the training dataset. Based on Kaplan-Meier survival estimates, 24.9% of the patients experienced a recurrent MACE within 2 years after the index event. The majority of the recurrent MACE events occurred in the first 3 months post-index, accounting for 49.7% of recurrent MACE within 2 years (Supplementary Material Figure 3). No major differences were found in the MACE rates in the training, test and validation sets.
Static Model Performance
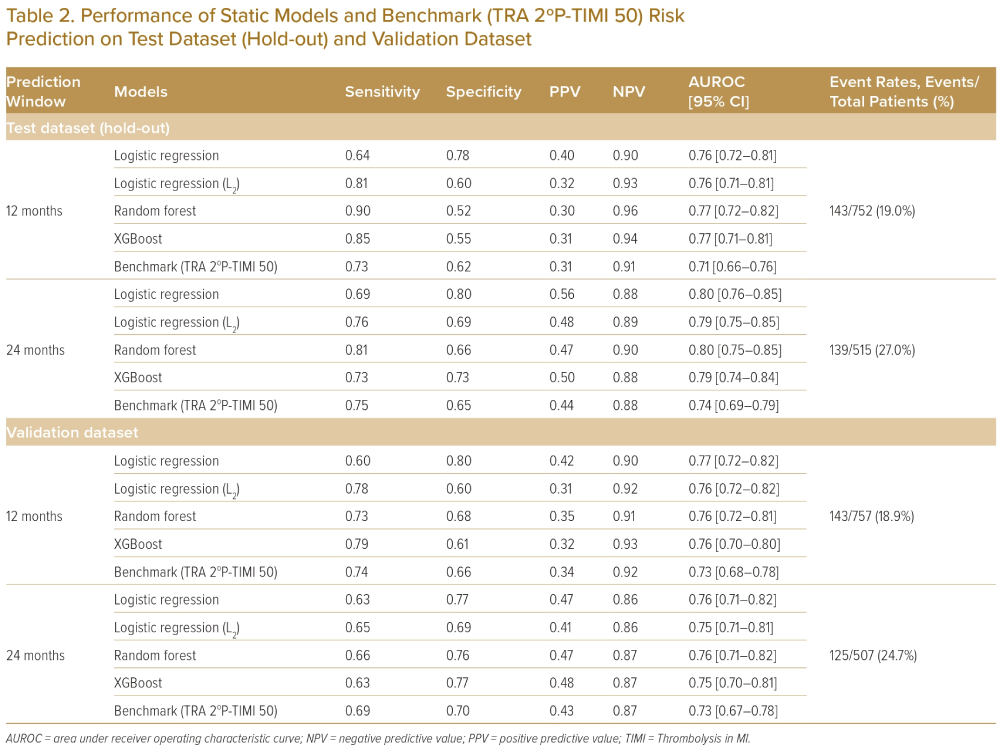
Using patients’ baseline information, including demographics, medical history, MI diagnosis, biomarkers measurement, prescriptions and procedures, four ML algorithms were developed to predict patients’ secondary CV risk as a static model at 1 and 2 years. The most predictive static model produced an AUROC of 0.77 for a 1-year MACE risk prediction and 0.80 for a 2-year MACE risk prediction on the hold-out dataset (Table 2).
Dynamic Model Performance
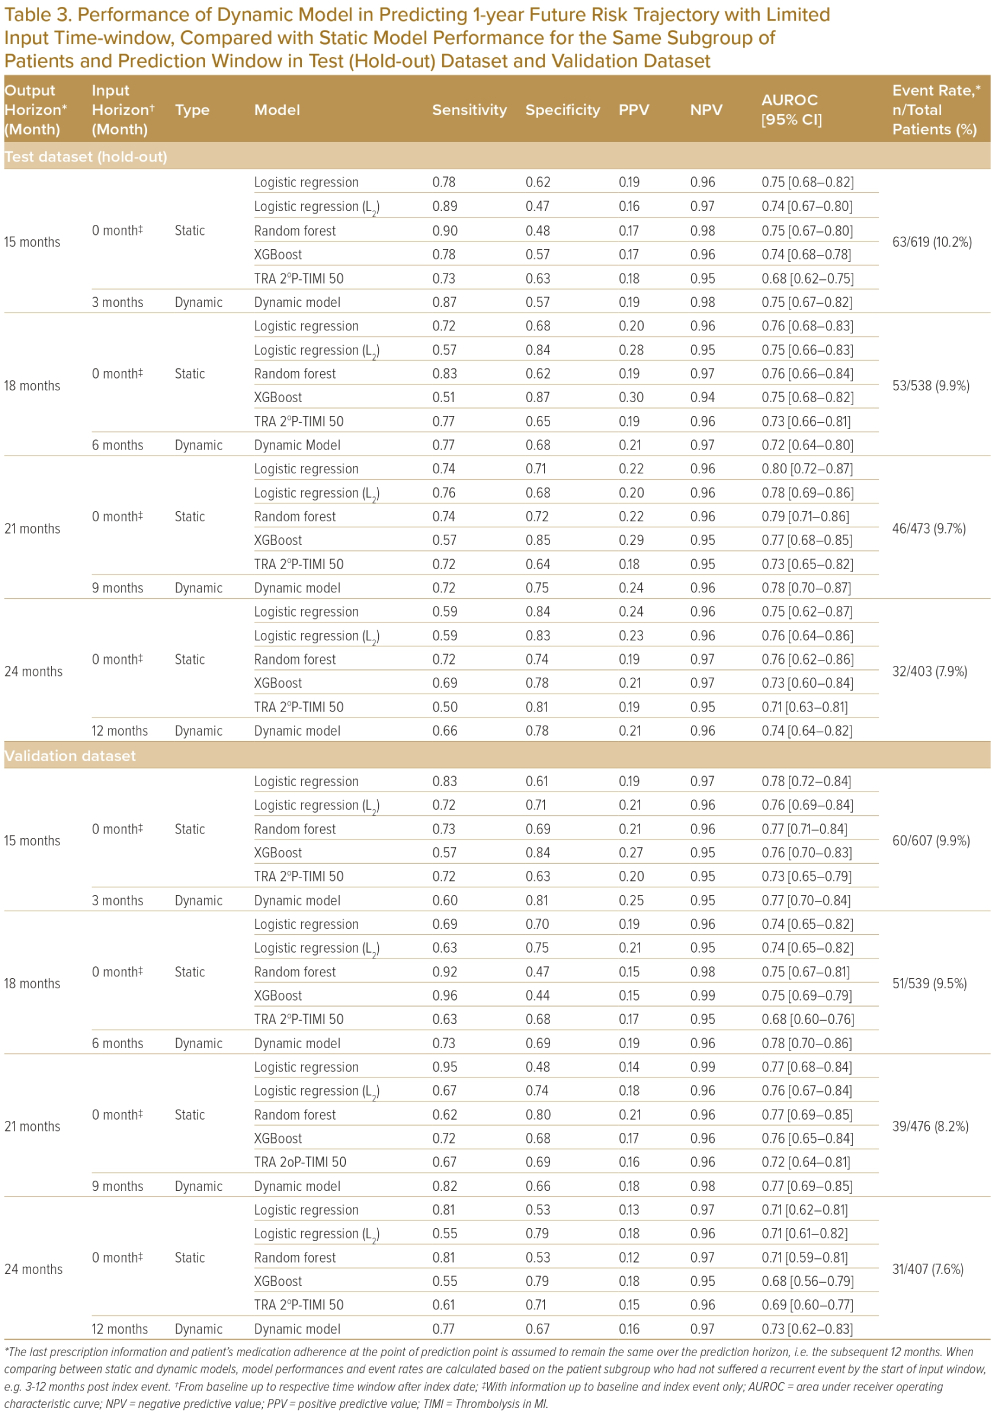
In addition to baseline information as used by the static model, the dynamic model incorporated post-discharge time-varying data such as medication adherence and post-discharge lab measurements to model evolving MACE risk. Table 3 shows the dynamic model’s performance in estimating patients’ 1-year recurrent MACE risk from 3, 6, 9 and 12 months post-index; the dynamic model predicts future risk through simulations with similar performance as the static model (Table 3, Supplementary Material Figures 4 and 5) on the same patient subgroup and various post-discharge time points. Other model performance metrics, such as sensitivity, specificity, PPV, NPV) were evaluated at thresholds which maximises Youden’s index on a receiver operating characteristic (ROC) curve (Table 3).22
The five most informative factors identified from permutation feature importance in the dynamic model in this sample are eGFR, diabetes at baseline (yes/no), age, lipid levels (HDL, LDL and total cholesterol were included as one composite group) and use of PCI or CABG at baseline (yes/no) (Supplementary Material Figure 6).
Comparison with Static Models and Benchmark (TRS 2ºP-TIMI 50 Risk Score)
The predictive performance of the dynamic model was compared to a TIMI secondary risk score (TRA 2oP-TIMI 50 risk score) (Table 3). The dynamic model predicted more accurately than TRA 2oP-TIMI 50 risk score on the SingCLOUD dataset (Table 3); however, certain assumptions for the SingCLOUD dataset (such as smoking status) were made due to limited data availability, which may have compromised the model performance of the TRA 2oP-TIMI 50 risk score. The five informative risk factors identified from the dynamic model agree well with several input covariates in the TIMI secondary risk score and the Framingham risk score, including age ≥75 years, diabetes, lipids, prior CABG and renal dysfunction (eGFR <60 ml/min/1.73 m2).5,7,23
Simulation Study: Population Level
Using the developed dynamic risk prediction model, simulation studies were performed to further derive insights from the model. In this simulation scenario, the objective is to assess the efficacy of an aggressive lipid-lowering therapy in reducing patient’s risk of MACE. A subgroup of high-risk patients (1-year recurrent MACE risk level >40%) with baseline LDL ≥70 mg/dl was selected for this analysis (n=703). Their risk trajectories were simulated for the scenario of their LDL levels lowering to 30 mg/dl with total cholesterol at 50 mg/dl from the end of the first month post-discharge onwards. On average, there was a relative risk reduction of 11.1% from 60.9% in the actual data to 54.1% in the simulation with lowered lipid level; a histogram of the 1-year risk estimates of these patients shows a discernible left shift (Supplementary Material Figure 7).
Simulation Study: Patient Level
The model may be used as a clinical decision support tool in an inpatient setting during follow-up visits once it is retrospectively developed. Different scenarios can be simulated by clinicians to inform the treatment strategy and its associated risk trajectories, potentially leading to individualised clinical management.
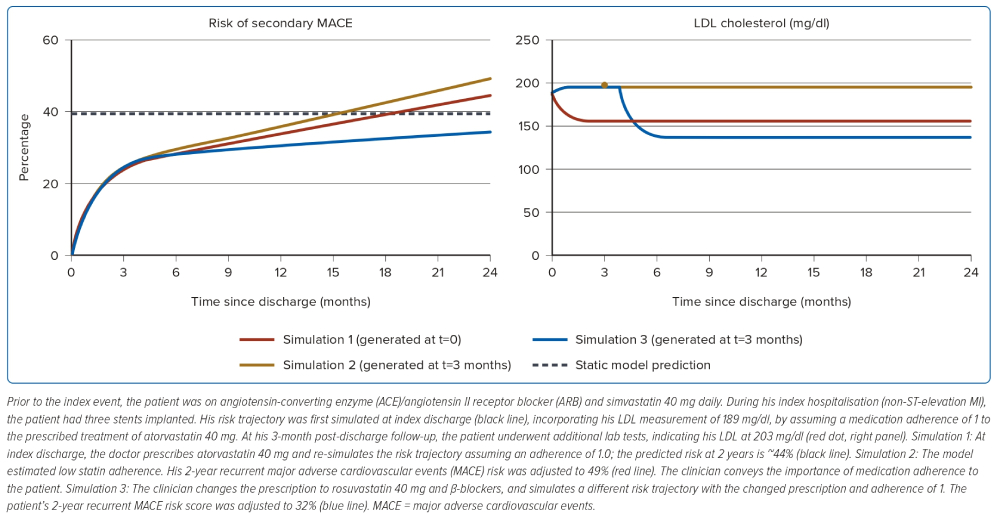
The use of the dynamic model during clinical practice is illustrated in Figure 2, with a case study of a 55-year-old Chinese man with a history of hypertension and diabetes. At discharge after index hospitalisation, the static model (XGBoost) predicted a 2-year MACE risk of 38%. At his 3-month follow-up, the patient underwent additional lab tests, indicating his LDL was 203 mg/dl; with that, the model estimated that the patient’s medication adherence was low and adjusted his 2-year MACE risk to 49%. A different treatment scenario where the prescriptions were changed to rosuvastatin and β-blockers with an assumed medication adherence of 1 lowered the patient’s 2-year MACE risk to 32%.
Discussion
Summary of Principal Findings
There are a number of cardiovascular risk scores, including Framingham, SCORE, QRISK and TIMI, that were developed based on North American and European populations to predict primary cardiovascular events. In this paper, we present a recurrent MACE risk prediction model based on an Asian population. The model addresses a population that is different in ethnicity, lifestyle behaviours and treatment; for instance, only 60.4% of post-MI patients were treated with primary reperfusion therapy (PCI or CABG) during the index hospitalisation in this study cohort, whereas for TIMI, 65.3% of that population had primary reperfusion therapy.24,25 Further, we developed a causal biological framework using a semi-mechanistic model-based ML approach, which enables differentiation of immediate risk components from long-term CVD progression. The model outperforms the existing benchmark risk score (TIMI) in this population by incorporating baseline, index event and post-MI follow-up data.
Causal Construction of the Dynamic Model
Quantification of the cumulative risk progression is an essential aspect of identifying patients as being high or low risk – this helps clinicians to determine the urgency to treat and to identify appropriate patient-specific disease management. Different risk prediction scores have been developed in the past, which can be broadly classified into conventional regression analysis, such as Cox proportional hazard model, and ML techniques that have been adopted more recently.10,26 Although the ML or deep learning models are more complex and predictive, they often lack clear physiological interpretability.
In this study, we developed a causal biological framework of semi-mechanistic models with neural networks to predict secondary cardiovascular risk. The model is capable of discriminating between immediate risk components and longer-term disease progression. The causal framework consists of the immediate, short-term risk component, R1, which is related to patients’ baseline information and information related to the index event; and R2 – the longer-term, gradual progression of disease, which is related to prescription and biomarker data and medication adherence during follow-up. The above discrimination confers a causal biological basis to the model and helps identify post-MI patients who are at a heightened risk of recurrent MACE events. The causal construction of the model enables clinical comprehension of risk components by de-coupling the complex biological interactions. Interestingly, in this implementation, there was no clear improvement in model performance for the dynamic relative to the static model. We theorise that the primary reasons for this are incomplete capture of post-index medication and the infrequent biomarker testing found in the real-world data.
Comparison with Benchmark Risk Score
A number of existing cardiovascular risk scores, including TIMI, were initially derived from primarily white populations and localised adaptation of cardiovascular risk scores to an Asian population is desirable, given the differences in ethnicity, lifestyle behaviours and treatment patterns among acute MI patients.7,24 In this study, we have developed a cardiovascular risk prediction model using a retrospective multicentre database from Singapore with a unique multiracial composition population made up of Chinese people (65.5%), Malay people (16.9%) and Indian people (13.1%)] (Table 1).
The TRA 2oP-TIMI 50 risk score was used as a benchmark for comparison, given its accessibility and availability of input data to TIMI risk score in SingCLOUD. Both the static and dynamic models showed an improvement in discriminatory capacity beyond the TRA 2oP-TIMI 50 risk score when validated on the SingCLOUD dataset (Tables 2 and 3), presumably reflecting the differences in lifestyle factors or underlying patient population from the derivation cohort of TRA 2oP-TIMI 50. Due to a lack of specific input covariates for TRA 2oP-TIMI 50 risk score (such as smoking status), certain assumptions were made, which may have compromised its predictive performance.
Use in Clinical Settings
Both models performed similarly on the hold-out dataset; we suspect in some instances, the dynamic model may outperform the static model if adequate follow-up data with a regular time interval was available.27 Static models use data – such as medical history, index procedures, biomarkers and vitals at admission – from the index event and before as input to predict post-discharge MACE risk. Static models, given their simplicity, could be more easily integrated into clinical workflow; however, they are not updated with time-varying post-MI information including medication adherence and other information gathered on follow-up. Conversely, dynamic models incorporate and learn from additional time-varying data, such as biomarkers during follow-up and patient-specific medication adherence. This should enable clear differentiation of immediate, acute risk components from long-term, progressive risk components; therefore, in theory, it should more convincingly encourage behavioural changes in patients with respect to modifiable risk factors. Although it seems like the implementation of a dynamic model could impose additional challenges during model deployment, most operations such as real-time inference from dynamic models are largely similar to that of the static model.
Using model-based simulations of individualised risk trajectories, a myriad of possible treatment scenarios can be explored and automated to optimise treatment strategies and enable minimisation of the risk of recurrent MACE. These models could also be implemented as a triaging tool to stratify patients into different subgroups so that patients could receive an appropriate level of care consistent with their risk status. Considering cost-effectiveness and benefit-risk in these decisions, a separate set of cost-sensitive cut-offs could be derived depending on the clinical application of the model, along with probable consequent outcomes and harms associated with false positive and false negative results.28–30
This is our first step towards building a predictive recurrent MI model. After further validation in an external dataset to substantiate generalisability, we envision that this model would be used by healthcare professionals, including case managers, in the inpatient setting during discharge planning or during subsequent follow-up visits to decide on the appropriate level of follow-up care. A separate prospective study is needed to fully understand the exact implications of such models when integrated into a care pathway.
Limitations
There are several limitations to the study. We were limited by missing data in some important predictors, including:
- Severity of coronary artery disease, including presence of single-vessel versus multi-vessel disease, presence of collateral circulation and residual disease post-vascularisation.
- Blood pressure measurement.
- Biomarkers and medications associated with insulin resistance.
- Other biomarkers such as ejection fraction, C-reactive protein, B-type natriuretic peptide and thyroid-stimulating hormone.31–33
In particular, two important features missing in the progressive component are blood pressure and HbA1c. Some losses to follow-up may have occurred due to overseas migration or due to transition of care from public to private; however, the impact of that could be limited due to the substantial coverage of the public hospitals on the SingCLOUD database, its link to the national death registry and cost differences between private and public care. Medication adherence is calculated based on assumption of near-complete prescription information, but this was clearly not the case. Given the outcome was modelled as dichotomous, time-to-event was not considered in this approach. The model threshold was derived from a cost-agnostic approach where false positives and false negatives were weighted equally, resulting in a relatively high proportion of false positives; however, in real-world clinical settings, a utility-based decision theoretic approach would be preferred in developing cost-sensitive cut-offs, where it builds in disease prevalence and misclassification costs, such that safety and effectiveness of the tool could be justified.34,35 Finally, potential selection bias could be introduced due to the requirement of having specific biomarkers available at baseline or follow-up. Model validation on external data sources is desired to evaluate generalisability of the model performance. We would also be cautious when using the model in non-Asian populations without validation, as the clinical practice and patient characteristics may be materially different.
Conclusion
In this study, we developed a model for prediction of recurrent cardiovascular events, which combines a novel causal framework with ML components to mimic a biological framework. To our knowledge, this is the first risk score based on a causal framework to predict recurrent cardiovascular events in a specific Asian population. The model performs comparably with existing risk scores on the validation dataset. When applied to clinical workflow, it can simulate personalised interventions, disease trajectory and its associated CV risk to allow exploration of different treatment options and may be used to aid clinical decision-making.
Click here to view Supplementary Material.
Clinical Perspective
- Several cardiovascular risk scores exist that predict primary cardiovascular events and were developed using data from North American and European populations.
- We presented a risk prediction model that is specifically for an Asian population, which identified several risk factors, including estimated glomerular filtration rate, diabetes, age, lipid level and prior percutaneous coronary intervention and coronary artery bypass graft.
- The reported predictive model has the potential to offer insights into patient-specific risk trajectory incorporating follow-up and other time-varying interventions.
- The model can be used to simulate an optimal treatment strategy to potentially maximise risk reduction of major adverse cardiovascular events.


