Frailty, as defined by the Singapore Ministry of Health, is a dynamic and evolving state of health that involves the gradual loss of physiological in-built reserves leading to losses in one or more domains of human function (physical, cognitive, psychological and/or social) and increases the vulnerability of older adults to adverse health-related outcomes. Frailty can be prevented, reversed or delayed in the early stages and managed in the later stages through early detection and interventions to optimise functional ability, activity participation and quality of life.1 Frailty is prevalent among older people and is associated with higher rates of usage across different healthcare services, increased emergency admissions and a higher predictive risk for a range of adverse health outcomes.2–5 In Singapore, attributed to the increasing proportion of residents aged ≥60 years, the proportion and number of frail individuals will increase, which will result in more frail patients attending hospitals, highlighting the need for suitable screening tools to stratify frail patients and identify those at highest risk.6–8
Identifying high-risk patients at the start of their hospitalisation episode or their point of discharge from the Emergency Department offers the opportunity to initiate early interventions to reduce future risk of adverse outcomes.9 However, the level of understanding regarding frailty among Singapore healthcare professionals is still varied, and there are multiple barriers to the implementation of frailty screening in acute care settings, such as lack of resources and perceived complexity of conducting frailty assessment.10
Among the various screening tools, the Hospital Frailty Risk Score (HFRS) is a low-cost screening tool that does not require clinical assessment, but uses routinely collected electronic health records. It has been shown to identify a distinct patient group with higher non-elective hospitalisation, increased 30-day mortality, length of stay (LOS) and 30-day readmission.11–13 It highlights at-risk patients and triggers further in-depth assessment, such as a Comprehensive Geriatric Assessment. The HFRS is non-operator dependent and has been validated against the two widely used clinical frailty screening tools: the Fried phenotype and the Rockwood Frailty Index, which require more manpower resources for face-to-face assessment.12 Currently, HFRS has been validated in multiple cohorts of patients in several countries.13–16 Locally, a recent study has validated the use of HFRS in patients with community-acquired pneumonia and another has shown delirium to be associated with HFRS.17,18
The aim of this study is to validate the use of HFRS in predicting patient outcomes among a specific cohort of patients admitted to Changi General Hospital from 1 January 2021 to 30 April 2021 with heart failure (HF). Congestive HF accounts for 4.5% of local hospital admissions in those aged ≥65 years, and the prevalence of HF increases with age.19,20
Frailty in HF is associated with higher rates of hospitalisation and mortality, with almost one in five hospital patients admitted with HF having an intermediate or high risk of frailty.21 Frailty has specifically been found to be additively associated with multiple abnormalities in cardiac structure and function, including impaired left ventricular (LV) systolic and diastolic function and LV hypertrophy.22 In addition, frailty in HF patients is also shown to be a strong predictor of the need for hospitalisation and an independent risk factor for increased hospital LOS, unplanned readmission and all-cause mortality.23–26
Hence, we postulate that HF patients with higher scores on HFRS will have poorer health outcomes and higher healthcare utilisation in the local context, emphasising the importance of assessing for frailty status early among admission of HF patients to reduce adverse outcomes.27
The primary outcome was to compare and validate the HFRS in predicting outcomes and hospitalisation usage in patients hospitalised for HF. The secondary outcome was to determine other contributory risk factors for frail patients that predict adverse outcomes.
Methods
Study Design and Oversight
The study involves a retrospective review of electronic medical records undertaken in patients aged ≥65 years admitted for HF from 1 January 2021 to 30 April 2021. Patients were identified using ICD-10 codes (I500, I501, I509) for HF. The analysis excluded any patients who had absconded or discharged against medical advice, those aged <65 years, those with chronic kidney disease stage 5 and/or on dialysis and patients who had received cardiac procedures.
The retrospective review was undertaken by a dedicated team comprising cardiologists, geriatric physicians, and a medical student. Data extraction was performed by the Health Systems Intelligence team and was analysed using Python (v3.6.4; Python Software Foundation) and R statistical software (v3.6.1; R Core Team 2019). Python was used for data pre-processing, while R was used for statistical analysis.
This study was submitted to SingHealth Centralised Institutional Review Board (CIRB) under CIRB reference number 2021/2770 for review and it was determined that the study does not fall into the human research definition but under the Human Biomedical Research Act 2015, as this was a retrospective design using clinical audit data. Ethics approval was subsequently provided under CIRB Ref No: 2022/2645. All the methods included in this study are in accordance with the declaration of Helsinki.
Demographic data included age, sex and race. The HFRS for each patient was calculated based on 109 three-character ICD diagnostic codes that were recorded as primary or secondary diagnoses during the index (current) hospitalisation and the previous two emergency admissions within the preceding 2 years and their associated weights (Supplementary Table 1).28 Patients were categorised into three frailty risk groups: high risk (>15), intermediate risk (5–15) and low risk (<5) of frailty as described by Gilbert et al.12 BMI was included if available within the 12 months prior to admission. For cases with no BMI recorded within the previous 12 months, imputation was performed to replace missing values (10%) with the median BMI of each age group (65–74, 75–84, 85–94, ≥95 years).29 Comorbidity was assessed using the Charlson Comorbidity Index (CCI). Other biomarkers reviewed included N-terminal pro-B-type natriuretic peptide (NT-pro-BNP) and urea (first value during the inpatient admission). LV ejection fraction (LVEF) was reviewed where available. Hospitalisation data included LOS, where long LOS was defined at ≥7 days, and 30-day unplanned hospital re-admissions. Mortality at 30 days, 90 days, and 1 year from the date of hospital admission were reviewed.
Statistical Analysis
Continuous variables are presented as mean and SD, while categorical variables are presented as counts and percentages. HFRS was analysed as a categorical variable (high, intermediate, low risk). To compare the association of the HFRS categories with various variables and outcomes, we conducted Pearson’s χ2 test, Fisher’s exact test, ANOVA and Kruskal–Wallis test as appropriate. In our analysis of 30-day readmission, those who died as inpatients were excluded from analysis. Univariate and multivariate logistic regression were used to evaluate the association between HFRS (as a continuous variable) and the relevant outcomes. The multivariate model was adjusted for age, sex, BMI, CCI, and LVEF (≤40% and >40%). Fifteen cases with missing LVEF results were excluded from the regression analysis. ORs with 95% CIs are provided as appropriate. The area under the receiver operator characteristic curve (AUC) was used to assess model discrimination. All statistical analyses were performed using a two-tailed test with a significance level of p<0.05.

Results
Baseline Characteristics
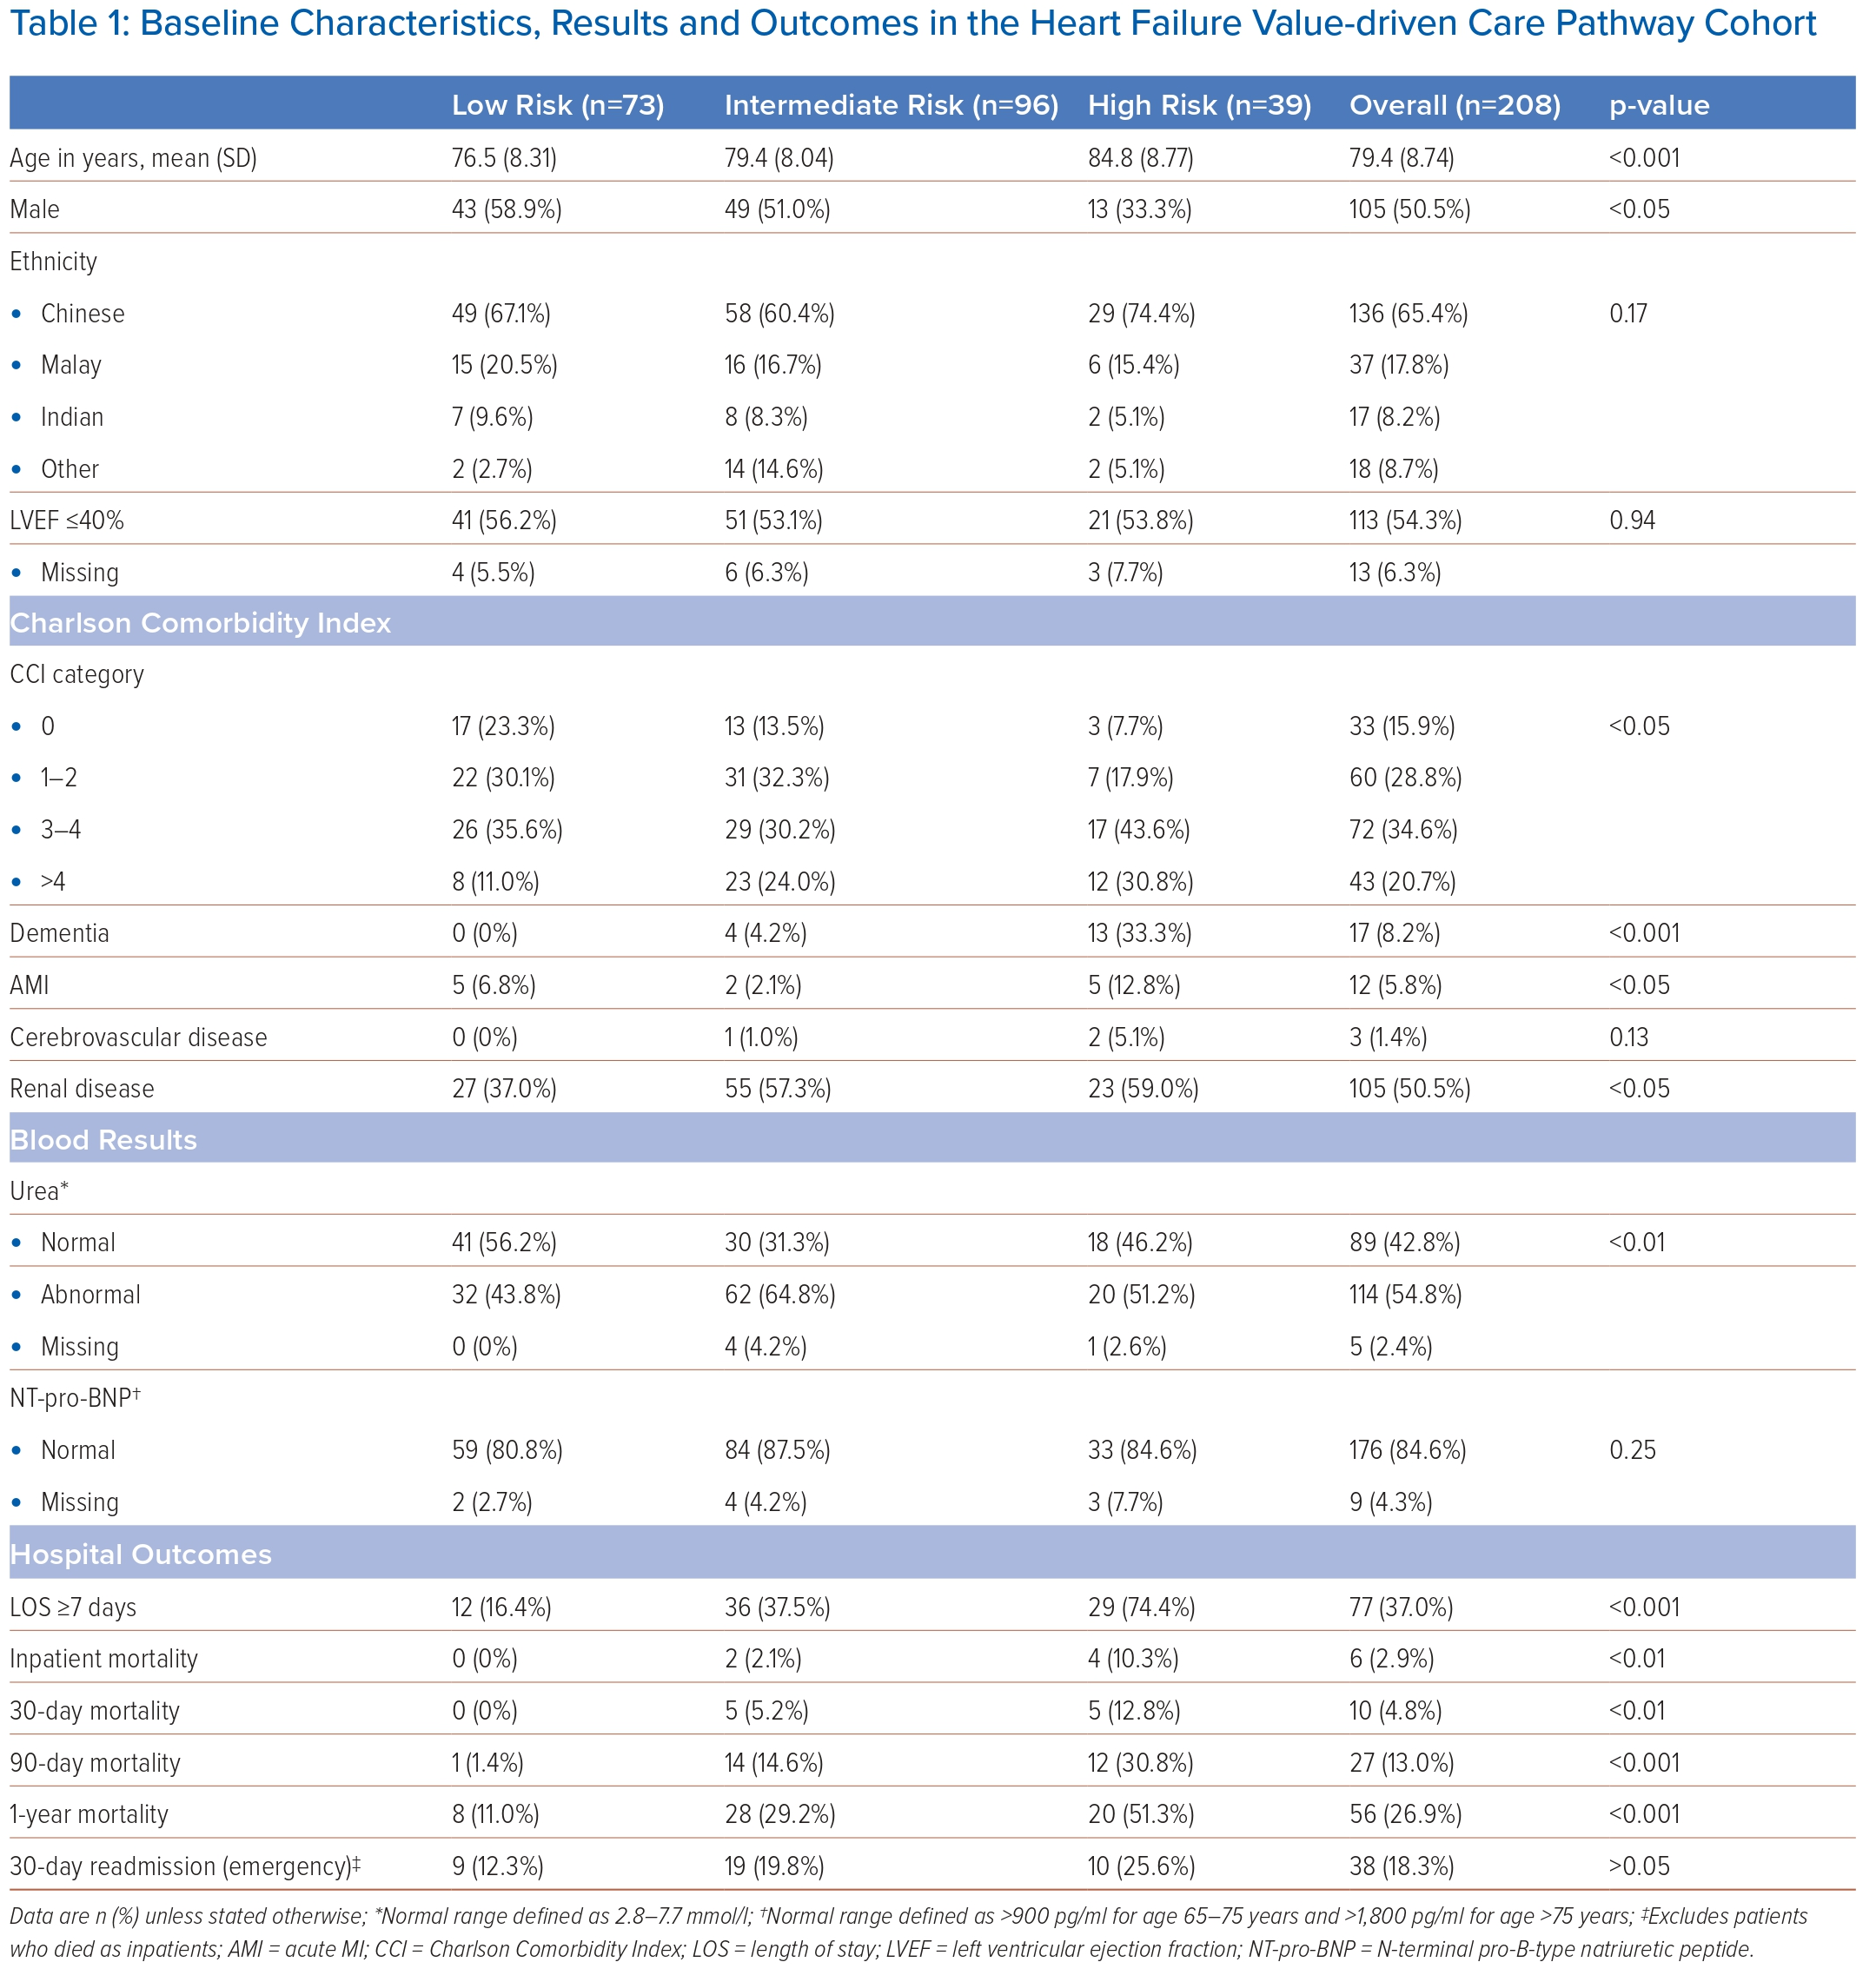
A total of 208 patients were admitted under the HF pathway of a tertiary hospital in Singapore between 1 January 2021 and 30 April 2021, of whom 50.5% were male and the mean age was 79.4 years (SD 8.74; Table 1) and 65% of patients overall were at high or intermediate risk of frailty. HFRS was categorised as low risk of frailty in 73 patients (35.1%), intermediate risk of frailty in 96 patients (46.2%) and high risk of frailty in 39 patients (18.8%). Those at high risk of frailty were older than those at low risk (84.8 years versus 76.5 years, respectively; p<0.001), with a higher proportion of females at high risk of frailty (p<0.05). Ethnicity was representative of Singapore’s population and was predominantly Chinese (65.4%), with Malay (17.8%), Indian (8.2%) and other races (8.7%).
CCI was statistically different across the frailty groups: zero for 15.9% of patients, 1–2 for 28.8%, 3–4 for 34.6% and >4 for 20.7% of patients (p<0.05). Those at higher risk of frailty had more comorbidities than those at low risk of frailty (CCI >4, 30.8% versus 11.0%; CCI 3–4, 43.6% versus 35.6%; CCI 1–2, 17.9% versus 30.1%; CCI 0, 7.7% versus 23.3%). Some comorbidities were more prevalent, such as dementia, where there was a higher prevalence of dementia in those at high risk of frailty (33.3% versus 0%; p<0.001), with only 4.2% of intermediate risk who had a diagnosis of dementia. Across the whole cohort, the prevalence of dementia was 8.2%. Patients with HF had a high prevalence of renal disease, with an overall prevalence of 50.5% across the whole group, and those at high risk of frailty had significantly more renal disease than those at low risk (59.0% versus 37.0%; p<0.05). However, this analysis is likely to under-represent the prevalence of renal disease, as the analysis criteria followed the recommendations for HF value-driven care pathway, which excludes those with stage 5 chronic kidney disease or undergoing renal dialysis.
Acute MI (AMI) was more common in those at high risk of frailty than those at low risk (12.8% versus 6.8%; p<0.05). Across the whole cohort, the prevalence of AMI was 5.8%. LV ejection fraction (LVEF) was not significantly different across the differing groups at risk of frailty (Table 1). Those with LVEF ≤40% comprised 54.3% of the cohort; those with LVEF >40% comprised 39.4% (no measurement was available for 6.3%). NT-pro-BNP was not different across the groups, but urea was more frequently abnormal in those at high risk of frailty (Table 1).
Primary and Secondary Outcomes
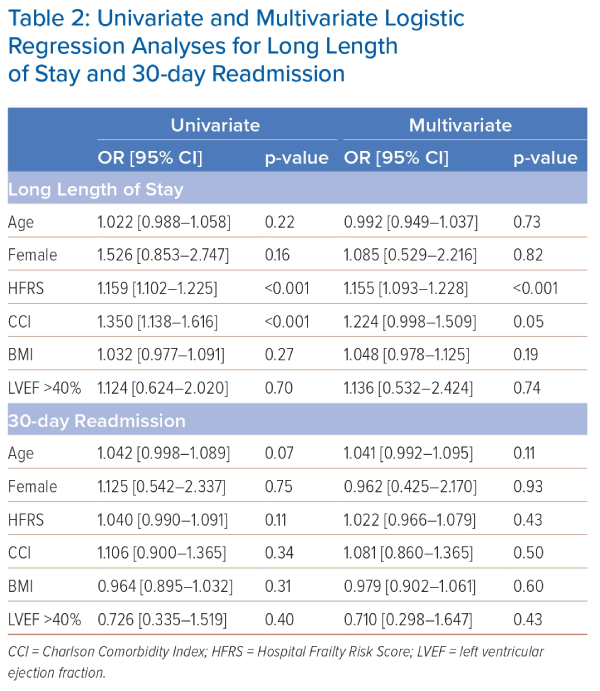
Long LOS, defined as ≥7 days, was significantly longer in those at high risk of frailty (74.4% versus 16.4%; p<0.001), but 30-day unplanned hospital re-admission was not significantly different in those at high risk of frailty (25.6% versus 12.3%; p>0.05; Table 1). Those who died as inpatients were excluded from the 30-day re-admissions. HFRS was associated with long LOS in both univariate analysis (OR 1.159; 95% CI [1.102–1.225]; p<0.001) and multivariate analysis (OR 1.155; 95% CI [1.093–1.228]; p<0.001; Table 2).

Mortality
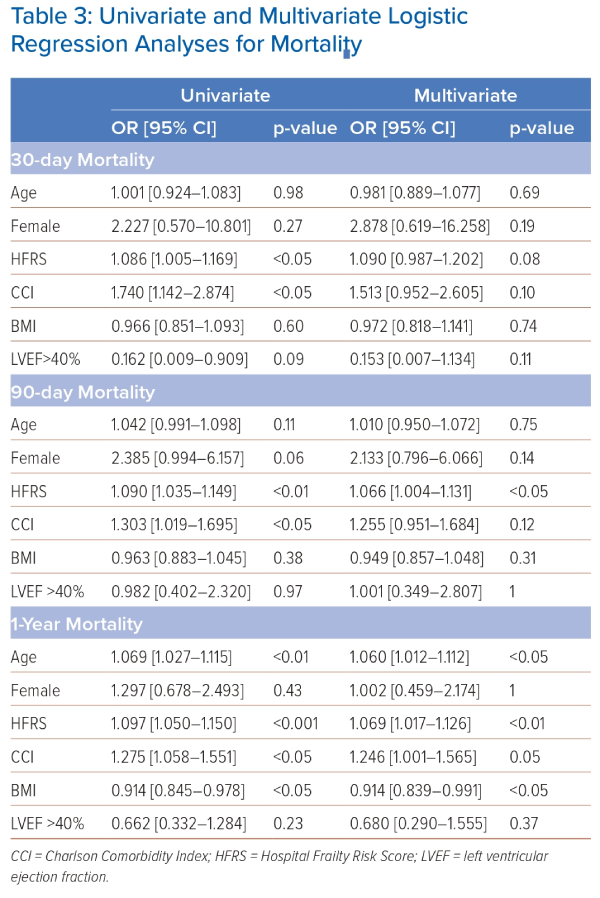
Mortality was higher at all time points measured in those at higher risk of frailty compared to those at low risk, including inpatient mortality (10.3% versus 0%; p<0.01), 30-day mortality (12.8% versus 0%; p<0.01), 90-day mortality (30.8% versus 1.4%; p<0.001) and 1-year mortality (51.3% versus 11.0%; p<0.001; Table 1). However, regarding mortality, only 90-day mortality and 1-year mortality were associated with HFRS in the multivariate analyses. For 90-day mortality, ORs were 1.090 (95% CI [1.035–1.149]; p<0.01) in univariate analyses and 1.066 (95% CI [1.004–1.131]; p<0.05) in multivariate analyses. For 1-year mortality, ORs were 1.097 (95% CI [1.050–1.150]; p<0.001) in univariate analyses and 1.069 (95% CI [1.017–1.126]; p<0.01) in multivariate analyses (Table 3). Age was also associated with 1-year mortality in both univariate and multivariate analyses (univariate: OR 1.069; 95% CI [1.027–1.115]; p<0.01 multivariate: OR 1.060; 95% CI [1.012–1.112]; p<0.05; Table 3).

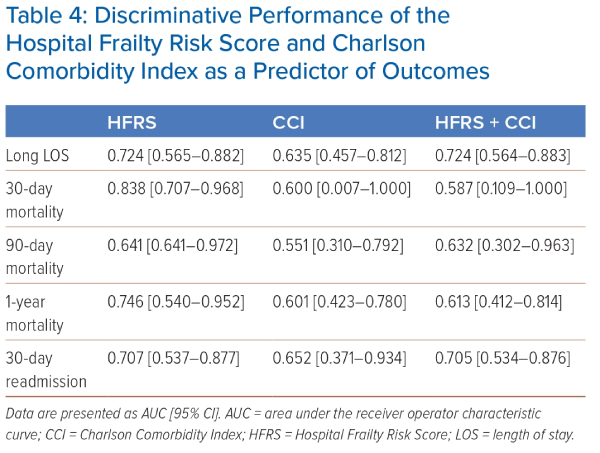
The discriminative performances of HFRS and CCI as predictors of outcomes were compared. HFRS was a better predictor than CCI of long LOS, mortality at 30, 90 and 1 year and 30-day readmission (Tables 2 and 4). HFRS alone remained a better predictor than HFRS and CCI used in combination. The AUCs for long LOS using HFRS, CCI and HFRS+CCI, respectively, were 0.724 (95% CI [0.565–0.882]), 0.635 (95% CI [0.457–0.812]) and 0.724 (95% CI [0.564–0.883]; Table 2). AUCs for mortality using HFRS, CCI and HFRS+CCI, respectively, were 0.838 (95% CI [0.707–0.968]), 0.600 (95% CI [0.007–1.000]) and 0.587 (95% CI [0.109–1.000]) for 30-day mortality, 0.641 (95% CI [0.641–0.972]), 0.551 (95% CI [0.310–0.792]) and 0.632 (95% CI [0.302–0.963]) for 90-day mortality and 0.746 (95% CI [0.540–0.952]), 0.601 (95% CI [0.423–0.780]) and 0.613 (95% CI [0.412–0.814) for 1-year mortality.
Discussion
Our validation study had several key findings. Higher HFRS was associated with a significantly longer LOS (≥7 days), higher inpatient mortality, 30-day mortality, 90-day mortality and higher mortality within 1 year of hospitalisation. HFRS was a better predictor of long LOS, mortality at 30, 90 and 1 year, as well as 30-day hospital re-admissions than CCI. Older female patients were more likely to be at high risk of frailty. Patients with higher HFRS were also more likely to have dementia (33.3%) and renal disease (59.0%). LVEF was not significantly different among the different frailty groups, nor was NT-pro-BNP. There was a trend toward higher 30-day unplanned hospital re-admission rates in the high HFRS group, but it was not statistically significant. Although higher HFRS values were associated with higher CCI scores, it was not a strong correlation. This might be because HFRS reflects certain aspects of frailty, e.g. falls and incontinence, which are not captured in the CCI.
Some benefits of the HFRS are that it is non-operator-dependent and does not require a clinical assessment. It has been validated against the two widely used clinical frailty screening tools, the Fried phenotype and the Rockwood Clinical Frailty scale, both of which require manpower resources and a face-to-face assessment.12 Comparison with the CCI was chosen because it is widely used with ease in administration in clinical practice. It has also been shown to predict HF readmissions within 30 days and 90 days in cases of HF with preserved ejection fraction.30,31 Although higher HFRS values were associated with higher CCI scores, it was not a strong correlation, and it is possible they are identifying different cohorts of patients. Another explanation may relate to the function of each tool: the CCI was developed as a predictor of mortality, whereas the HFRS aims to identify frail patients with more broad adverse outcomes, including LOS and hospital re-admission.
Although both scores do overlap in the conditions they identify – such as renal disease, dementia and cerebrovascular diseases – the weighting assigned within these models is different. For example, Alzheimer’s dementia is the highest weighted code for HFRS (7.1, where weights range from 0.1 to 7.1) but the lowest weighted in the CCI (1, where weights range from 1 to 6). The HFRS also includes conditions such as falls, incontinence and electrolyte imbalance, which are not featured in the CCI. However, the CCI does include cancers and diabetes, which are not featured in the HFRS.
The results of our validation study examining the association between HFRS and outcomes in patients admitted with HF are further supported by multiple studies. Kwok et al. showed higher inpatient mortality (12.7% versus 2.2%), LOS (11.3 versus 4.6 days) and cost of admission ($23,084 ± 39,681 versus $9,103 ± 12,768) for HF patients in the high-risk frailty group compared with low-risk groups.21 They also found the need for advanced mechanical cardiac support, e.g. LV assist device, intra-aortic balloon pump or vasopressor use, to be almost fivefold higher (OR 4.90) in high-risk compared with low-risk groups. McAlister et al. also demonstrated higher 30-day (15.7% versus 7.1%) and 90-day (28.7% versus 11.8%) mortality for HF patients with high HFRS compared with the low HFRS group.32 A validation study by Sharma et al. in Australia found 30-day mortality (OR 2.02 and 3.11), LOS (OR 1.67 and 2.17), and 30-day readmissions (OR 1.64 and 1.79) were significantly higher in intermediate- and high-risk HFRS groups compared with the low-risk HFRS group.33 Hence, HFRS can be used to identify frail older patients with HF and identify target areas for improvement in HF care pathways.
Strengths and Limitations
Strengths of our study include that we were able to analyse a large group of older patients admitted with HF, of whom a majority (136; 65%) were at intermediate or high risk of frailty. We were also able to find a positive association of frailty with other comorbidities, such as dementia and renal disease, which may affect outcomes in such HF patients. Sarcopenia in HF patients is a well-known comorbidity owing to reduced exercise and aerobic capacity restricting daily activity and mobility. There is increasing evidence that early initiation of interventions in both pre-frail and frail patients with HF improves muscle strength and even reverses skeletal muscle atrophy.34,35 Early recognition of this group of frail patients will enable the initiation and delivery of frailty interventions early on in hospitalisation, thereby preventing hospital-related functional decline. Our teams are currently testing a modified version of the HFRS that will allow its use as a bedside tool, not just as a population-based quality improvement tool.
Limitations of our study include the fact that HFRS relies on accurate coding, which means retrospective scoring 6–8 weeks after the index hospitalisation, hence missing frailty scoring during a patient’s current admission. Inaccuracy of coding and documentation of information may also create bias. Another limitation may relate to using ICD-10 codes, which may miss other components of frailty, such as polypharmacy, for which information is not captured. The HFRS score also does not take into account functional status and patient abilities as well as the severity of comorbidities, all of which are important contributors to overall frailty assessment. Our study also did not have prescription data, which is important as the use of goal-directed HF therapy contributes to differences in patient outcomes.36 Finally, a retrospective review has potential bias, and further prospective studies are needed to confirm these findings.
Conclusion
To our knowledge, this is the first locally validated study examining the HFRS in older patients with HF in a tertiary hospital in Singapore. Our study has validated the HFRS in an Asian population and has shown that patients with higher HFRS have higher mortality, longer LOS and higher healthcare utilisation. We conclude that HFRS is a useful screening tool for the early identification of high-risk HF patients for frailty interventions. Frailty interventions align well with current in-hospital HF care pathways. However, more work needs to be done to extend such interventions beyond the hospital for the reversal of frailty or to better address end-of-life issues in those in whom frailty cannot be reversed. 
Click here to view Supplementary Material
Clinical Perspective
- The Hospital Frailty Risk Score (HFRS) can identify frail older patients with heart failure without the need for clinical assessment.
- The HFRS was a better predictor than the Charlson Comorbidity Index for those at risk of longer length of stay.
- High HFRS was a better predictor than Charlson Comorbidity Index for those at risk of mortality.
- Dementia, acute MI and renal disease are common in heart failure patients at high frailty risk.
- HFRS can be used to identify target areas for improvement in Heart Failure care pathways and has the potential for development as a simple, low-cost screening tool for frailty.


