


Epidemiological studies have shown that in 2019, 12.7 million new cases of cardiovascular disease (CVD) were registered in European countries, of which more than 2 million were in Russia.1 One of the main risk factors for the development of CVD is hypercholesterolaemia.2,3 The prevalence of lipid disorders in Russia was studied in the ESSE-RF multicentre study, which enrolled 21,048 patients from 13 regions of the country.4 The level of total cholesterol >5.0 mmol/l was detected in 58.4% of the study population, without any significant differences between men and women. Hypercholesterolaemia is currently considered the main contributing factor to the high prevalence of CVD in Russia.
Only two-thirds of patients with acute coronary syndrome (ACS) who underwent invasive coronary angiography a few weeks or months before its onset had haemodynamically significant narrowing of the vessel.5 However, the likelihood of developing ACS largely depends on the presence of unstable (vulnerable) atherosclerotic plaques (AP). It can be assessed by coronary artery imaging techniques, which provide high-resolution images. AP vulnerability is associated with its morphological features and severity of arterial remodelling, which is manifested by an increase in the outer diameter during accommodation to the growing AP to prevent narrowing of the vessel lumen.6,7 The use of modern lipid-lowering drugs has a stabilising effect on AP and reduces the likelihood of progression of vascular remodelling.
Our objective was to study the role of cardiac imaging methods in the detection of vulnerable AP within the coronary arteries and their stabilisation using various lipid-lowering drugs.
Methods
The databases searched were PubMed and Web of Science up to April 2023, with English constraints. The search Medical Subject Headings (MeSH) were “coronary artery disease”, “vulnerable plaque”, “statin”, “alirocumab”, “evolocumab”, “PCSK9 inhibitor(s)”, and “optical coherence tomography” (OCT), and “intravascular ultrasonography” (IVUS), and “computed tomography coronary angiography”.
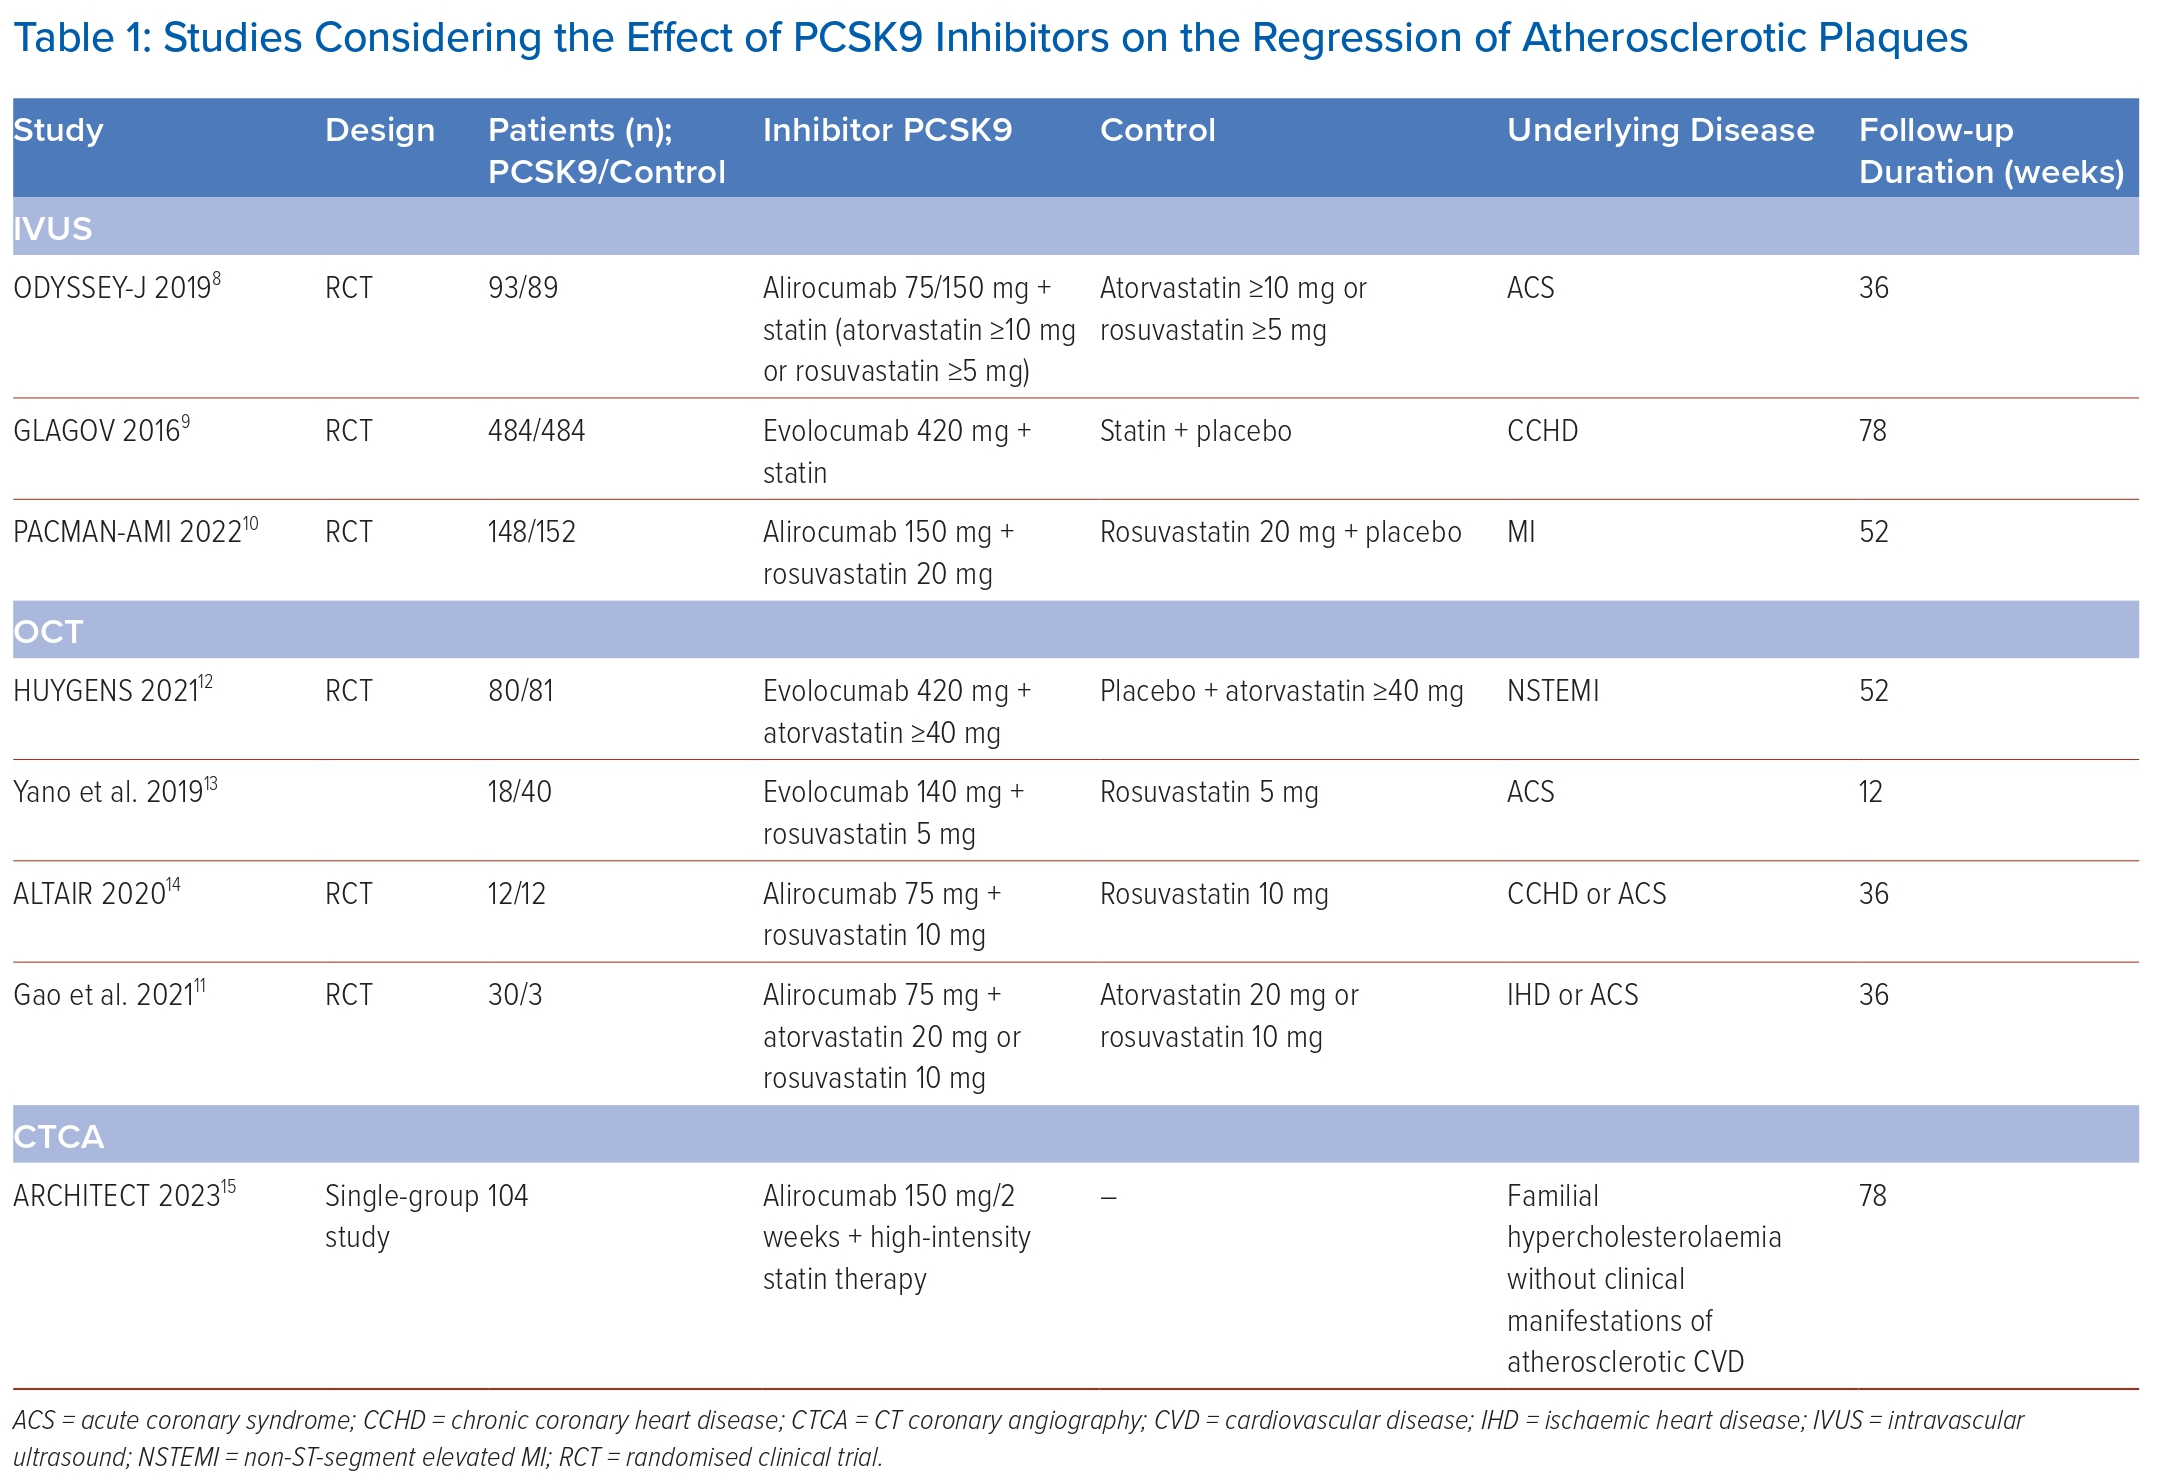
The following criteria were used to exclude studies: published abstracts, reviews, letters to the editor, case reports and meta-analyses. In total, eight relevant articles were selected and all of them were original clinical studies (Table 1).8–15
Stable and Unstable Atherosclerotic Plaques
The differentiation of APs into stable and unstable is extremely important for determining the patient’s prognosis and depends on the structure, size and configuration of the AP. Stable plaques are characterised by thick, dense fibrous cap rich in collagen. They are characterised by slow growth over many years and may not significantly affect the blood supply to organs. Distinctive features of unstable APs are a thin (<65 μm) fibrous cap, signs of acute inflammation (infiltration of the fibrous cap with inflammatory cells, mainly macrophages, activated T-cells and mast cells), the presence of a large lipid core (>40% of the AP volume), areas of spotty calcifications and haemorrhage into the nucleus.16
AP destabilisation develops due to several processes in the vascular wall, such as ferroptosis, necroptosis, secondary necrosis, pyroptosis and inflammation. The combination of these processes contributes to the thinning of the fibrous cap and, under certain conditions, to its rupture, which is accompanied by the activation of the blood coagulation system and the formation of a thrombus. Depending on the size of the formed thrombus and its localisation, this process is clinically manifested by unstable angina pectoris, MI, ischaemic stroke or thrombosis of the peripheral arteries. AP instability is also associated with a high risk of fatal cardiovascular events. It has been established that up to 70% of cases of acute coronary thrombosis occur against the background of unstable AP, and sudden coronary death occurs due to the rupture of the AP followed by thrombosis in 73% of cases.17,18
The Role of Imaging Methods in the Diagnosis of Vulnerable Atherosclerotic Plaques
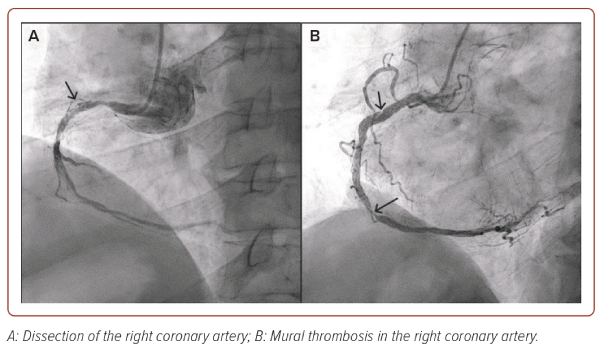
Invasive coronary angiography is the gold standard method for the diagnosis of atherosclerotic lesions of the coronary arteries (Figure 1). However, this method does not allow the prediction of the development of acute cardiovascular events, visualising the components of the vessel wall and evaluating the signs of instability of AP. Besides, in some cases, it cannot provide high-quality visualisation, especially in the presence of calcifications or overlapping views.19
The invention of modern imaging techniques and their implementation in clinical practice has expanded opportunities for diagnosing vulnerable APs. The first method, which appeared more than 30 years ago, and made it possible to study the AP parameters in vivo was intravascular ultrasound (IVUS).20 IVUS allows real-time assessment of the longitudinal and transverse dimensions of the vessel, the severity of its remodelling, and the size and structure of the AP. While coronary angiography provides visualisation of only the projection of the lumen and does not allow assessing the structure of the vascular wall, IVUS makes it possible to study the structure of the arterial wall (intima, smooth muscle and connective tissue layers). IVUS-controlled PCI reduces the likelihood of suboptimal stent deployment, incomplete atherosclerotic lesion coverage and vascular wall dissection, and increases the minimum stent lumen area compared to angiographic control.21,22 These benefits have been associated with the reduction in the frequency of ischaemic events.23
Since the first publication of the results of the PROSPECT trial, IVUS had been considered a classic tool for assessing characteristics of vulnerable plaques, but at the moment, the capabilities of this technology are not enough to reliably determine the individual components of the AP, which are currently considered the determining factors for its vulnerability.24 This has contributed to the development of more advanced IVUS modifications using special computational algorithms that provide additional information about the vulnerability of the AP.
Near-infrared spectroscopy (NIRS)-IVUS provides more detailed evaluation of plaque composition compared to IVUS.25 Stone et al. showed that identification of the lipid-rich plaque by NIRS during elective PCI can identify patients with increased likelihood of periprocedural MI after stenting.26 Compared with other modalities NIRS can be used in patients with severe calcified plaques and implanted stents.
The NIRS chemogram represents a colour-coded map where yellow is equivalent to the highest probability of lipid-rich plaque.27 A measure of the lipid burden in the AP is provided as lipid core burden index (LCBI): number of yellow pixels on the chemogram divided by all pixels and then multiplied by 1,000. In the prospective LRP study, more than 1,200 patients with coronary artery disease (CAD) underwent multivessel NIRS-IVUS imaging and were then followed up for 2 years.28 In this study, the relationship between maximum LCBI within any 4 mm long segment (maxLCBI4mm) values and the risk of major adverse cardiovascular event (MACE). maxLCBI4mm threshold value >400 in non-culprit segments was associated with at least a double risk for MACE. In the YELLOW trial, patients with obstructive CAD receiving a higher dose of statin showed a significant reduction in LCBI4mm (reduction −32.2 versus −0.6%; p=0.02) after a 7-week follow-up period.29
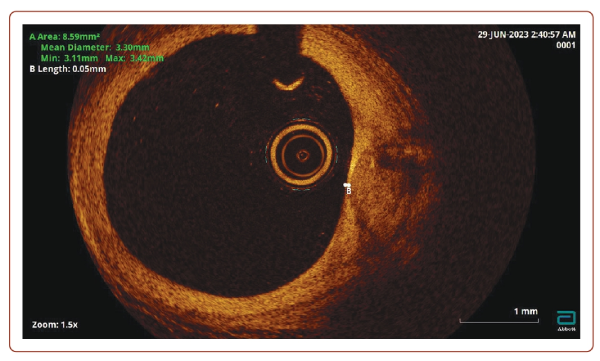
OCT is a high-resolution imaging technique that is most used to assess AP vulnerability (Figure 2). OCT was first proposed in 1991 at the Massachusetts Institute of Technology to visualise the cross-section of the retina. In 2001, OCT was applied for intracoronary imaging, and has since been widely used to assess the condition of the walls of the coronary arteries. Near-infrared light is used to obtain a cross-sectional image of the arteries. This has a higher frequency and shorter wavelength radiation compared to ultrasound, which provides a sharper resolution (about × 10) than with IVUS.
In addition, OCT makes it possible to detail the degree and thickness of calcification, determine fibrous AP and lipids in its structure, as well as detect intimal ruptures and classify thrombi into coagulation (red) and platelet (white) thrombi based on the intensity of signal attenuation.30 It has been shown that the sensitivity of OCT in detecting a thrombus approaches 100%, while for IVUS it is 33%.31 The resolution of OCT makes it possible to accurately identify vulnerable APs according to the following characteristic parameters: a large necrotic nucleus, a thin fibrous capsule, neoangiogenesis and inflammatory changes in the AP cap.17,32
In addition to preprocedural sizing, OCT provides preliminary information about the type of thrombus, ulceration of the AP and calcification, which can pose technical challenges with regards to the delivery of equipment and stent expansion.33,34 The role of several OCT parameters such as minimum lumen area have been evaluated in a previous study.35 The ILUMIEN III trial showed that an OCT-guided stent sizing and optimisation was at least non-inferior to IVUS in patients with non-complex lesions, and it was superior in achieving larger stent expansion compared with angiography.36
After stenting, OCT allows automatic measurement of the minimum area of the stent and the area of the lumen of the control vessel, evaluating the dilatation achieved. In addition, OCT detects dissections and perforations that occur during the stenting process.34,35
OCT is characterised by low signal penetration into the tissues (to the depth of 1–3 mm), which does not allow the visualisation of the arterial wall to the full depth and required lumen clearance by contrast. The technique for assessing the size of the vessel during OCT is currently being improved.37 The greatest advantage of OCT in comparison with IVUS is the ability to evaluate the stent restenosis, as mild neointimal AP is often not detected by IVUS, and calcium deposit assessment.35,38 Another advantage of OCT is its good reproducibility of measurements, which is important both in clinical practice and in scientific research. The possibility of overcoming the limitations of IVUS and OCT techniques by creating a hybrid intravascular imaging is being studied.39
Percent atheroma volume, total atheroma volume, maximum lipid core burden index within 4 mm (maxLCBI4mm), minimal fibrous cap thickness, maximum lipid arc, lipid length and macrophage grade are the main characteristics of vulnerable AP.9–11
CT is the next imaging technique that allows assessment of the state of the coronary bed. The CT image is a map of the X-ray density distribution of an object, expressed in the standardised Hounsfield units (HU). The advent of CT coronary angiography (CTCA) has provided unique opportunities for non-invasive diagnostics of coronary artery damage. In recent years, criteria for AP instability have also been recognised, which may be of great importance for further management of the patient (Figure 3).40 These include:
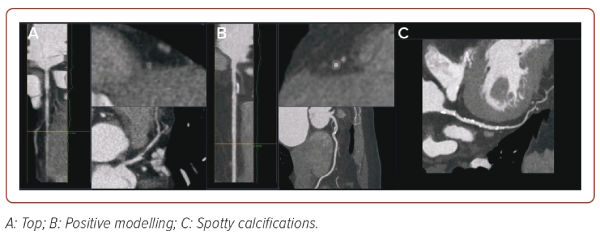
- Positive remodelling (foci of vascular dilatation), increase in the total volume of the AP, leading to a relative expansion of the diameter of the coronary artery. To assess it, a quantitative indicator is used, the remodelling index (RI), which is calculated by the formula RI = D1/D2, where D1 is the diameter of the vessel at the level of the plaque and D2 is the diameter of the intact segment proximal to the plaque. Positive remodelling is considered to be an excess of the vessel diameter at the plaque level by more than 10% compared to the reference segment.
- Presence of a low-density area within the plaque (<30 HU).
- Spotty calcifications within the plaque – uneven inclusions of small calcium deposits <3 mm.
- Napkin-ring sign – a ring-shaped increase in X-ray density along the periphery of the plaque, not exceeding 130 HU.
In addition to these features, the American Heart Association (AHA) proposed some geometric characteristics of the coronary arteries:41
- Distance from the ostium of the vessel to the stent – the smaller the distance from the ostium to the stent, the higher the risk of developing ACS (<39 mm for the left coronary artery and <60 mm for the right coronary artery).
- Tortuosity – presence of one bend more than 90° or three bends from 45° to 90° using a three-point angle inside the lesion.
- Bifurcation lesion.
CTCA allows detection of non-calcified APs in 83% of all cases detected by IVUS, mixed APs in 94% and calcified APs in 95%.42
The drawback of CTCA is unreliable detection of AP with a thin cap due to insufficient spatial resolution (about 0.3–0.5 mm). For the same reason, CTCA does not clearly distinguish plaques with an intact cap in patients with ACS from lesions in patients with stable angina. However, the presence of an AP with a thin cap can be detected indirectly based on the presence of a napkin-ring sign in the cross-section of the artery, which is visualised with the predominance of the lipid component in the AP structure, manifestations of angiogenesis and the presence of spotty calcifications.43
AP volume parameters obtained by CTCA have a high degree of correlation with similar parameters obtained during IVUS. Plaques with signs of positive remodelling, with low density, spotty (<3 mm) calcifications were significantly more often observed in patients with ACS, while patients with stable CAD were more likely to have larger calcifications.44,45
Thus, CTCA, despite its insufficiently high resolution, can provide the most important information for the stratification of cardiovascular risk. Besides, it may be useful in identifying patients at high risk of recurrent ischaemic complications after ACS without ST elevation due to measurement of the total number of non-calcified APs associated with a poor prognosis.
PET refers to the methods of radionuclide diagnostics, and among numerous indications, is also the main method for molecular imaging of atherosclerosis. Fluorodeoxyglucose (FDG) visualisation of unstable AP is based on the fact that increased metabolic activity within the plaque is ensured by an active macrophage response. It has been observed that the severity of FDG accumulation within the AP is proportional to the number of macrophages within it, but has no correlation with the area and/or volume of the AP. This method is quantitative and its main SUV (standardised level of radiopharmaceutical capture) indicator turned out to be highly reproducible, which allows objective comparisons to be made over time.46,47 In contrast to CT, PET with FDG is able to show the inflammatory component of the plaque, and the maximum FDG uptake reflects the high level of inflammation, which makes it prone to rupture.48 Another area of interest for FDG imaging is the assessment of inflammatory processes in the area of coronary artery stenting. To date, more than 20 radionuclides are known to allow visualisation of various stages of atherogenesis in animal models or in vitro, with an emphasis on the visualisation of unstable APs.49
The Role of Imaging Methods in Evaluating the Effectiveness of Lipid-lowering Therapy
Statins are one of the most studied classes of drugs for primary and secondary prevention of CVD. If the target LDL level is not achieved on a maximal dose statin, it is recommended to add an inhibitor of cholesterol absorption, ezetimibe.50 Ezetimibe monotherapy may be considered for patients with statin intolerance, but such an approach has not been studied in randomised clinical trials.
Proprotein convertase subtilisin/kexin type 9 (PCSK9) inhibitors are monoclonal antibodies. Their invention is closely related to the discovery of the role of the PCSK9 gene and protein in cholesterol metabolism. Binding of the PCSK9 enzyme to LDL receptor domains leads to their degradation and, accordingly, to a decrease in their distribution density, which causes a decrease in LDL metabolism and leads to hypercholesterolaemia. Targeted inhibition of PCSK9 by monoclonal antibodies increases the number of active LDL receptors, followed by an increase in the uptake of LDL from the bloodstream and its decrease in plasma.51
Currently, the intensification of lipid-lowering therapy in patients with very high cardiovascular risk is considered an effective and justified strategy. According to the latest version (2023) of the Russian guidelines on the management of lipid disorders:50
- If there is a significant increase of LDL in patients with a very high risk (>4.0 mmol/l), it is recommended to consider an initiation of a statin and ezetimibe, preferably in one tablet or capsule.
- If there is a significant increase of LDL in patients with extreme or very high risk (>5.0 mmol/l), it is recommended to consider initiation of a statin at the maximum tolerated dose + ezetimibe + PCSK9 inhibitor: alirocumab, evolocumab or inclisiran.
Effectiveness of combined lipid-lowering therapy and its influence on features of AP vulnerability were evaluated in numerous studies using imaging techniques (IVUS/OCT/CTCA).
The Odyssey J-IVUS study comprised 206 patients with ACS within 4 weeks prior to enrolment with LDL ≥2.59 mmol/l. The first group received atorvastatin ≥10 mg/day or rosuvastatin ≥5 mg/day.8 The second group received a combination of a statin and alirocumab (75 mg every 2 weeks), and if after 14 weeks of the study the level of LDL was ≥2.59 mmol/l, the dose of alirocumab was increased to 150 mg every 2 weeks. The total duration of the study was 36 ± 2 weeks. IVUS was performed at the onset and at the end of the study. Based on the results of IVUS, there was a decrease in the percentage change in the normalised total volume of AP by 3.1% in the monotherapy group and by 4.8% in the combination therapy group (p=0.23). The absolute change in the percentage volume of AP was 1.3 and 1.4%, respectively (p=0.79). LDL levels after 36 weeks of the study decreased by 13.4% in the monotherapy group, while in the group of combined lipid-lowering treatment it decreased by 63.9% (p<0.0001). The safety parameters among the groups were comparable.
The GLAGOV study included 968 patients with CAD.9 The first group received evolocumab (420 mg monthly), the second received a placebo. The total duration of the study was 78 weeks. IVUS was performed at the beginning of the study and after 78 weeks. The percentage of atheroma volume (PAV) increased by 0.05% in the placebo group and decreased by 0.95% while receiving evolocumab (95% CI [−1.8, –0.64]; p<0.001). Normalised total atheroma volume (TAV) decreased by 0.9 mm3 in the placebo group and by 5.8 mm3 in the evolocumab group (95% CI [−7.3, –2.5]; p<0.001). Plaque regression (for PAV) was observed in 64.3% of patients receiving evolocumab versus 47.3% of those on placebo. Besides this, lower LDL levels were achieved in the evolocumab group (5.2 versus 2.0 mmol/l; 95% CI [−59.7, –53.4]; p<0.001).
The PACMAN-AMI study included 300 patients undergoing PCI due to acute MI. Patients received alirocumab (150 mg every 2 weeks) or placebo in addition to therapy with rosuvastatin 20 mg/day.10 The follow-up period was 52 weeks. NIRS IVUS and OCT were performed at the beginning and end of the study. As a result, mean change in AP volume decreased by 2.13% in the alirocumab group and by 0.92% in the placebo group (95% CI [−1.78, −0.65]; p<0.001). The mean change in the minimum fibrous cap thickness was 62.67 µm in the alirocumab group and 33.19 µm in the placebo group (95% CI [11.75–47.55]; p=0.001). Mean change in maxLCBI4mm was −79.42 with alirocumab versus −37.60 with placebo (95% CI [−70.71, −11.77]; p=0.006).
A study by Gao et al. included 61 patients with chronic CAD or ACS, and with coronary artery narrowing of 50–70% diameter, with LDL ≥1.81 mmol/l for patients with ACS or ≥2.59 mmol/l for patients without ACS.11 All patients received rosuvastatin ≥10 mg/day or atorvastatin ≥20 mg/day, and alirocumab (75 mg every 2 weeks) was added later to the first group patients only. The total duration of the study was 36 ± 2 weeks. OCT was obtained at baseline and on 36 weeks. As a result, a statistically significant increase in the minimum fibrous cap thickness (18.0 [10.8–29.2] versus 13.2 [7.4–18.6] µm) was obtained in the combination therapy group compared to the monotherapy group; p=0.029) and minimum lumen area (0.20 [0.10–0.33] versus 0.13 [0.12–0.24] mm2; p=0.006), as well as a greater decrease in the maximum lipid arc (15.1° [7.8–24.5] versus 8.4° [2.0–10.5], p=0.008). The decrease in LDL levels in the combination therapy group was significantly greater than in the monotherapy group (1.72 ± 0.51 versus 0.96 ± 0.59, p<0.0001).
The HUYGENS study included 161 patients with MI without ST segment elevation. Evolocumab (420 mg/month) was compared with placebo.12 The follow-up period was 52 weeks. A series of OCT was performed during the study. In the evolocumab group, they obtained a more pronounced increase in the minimum cap thickness (+42.7 versus +21.5 μm; p=0.015), a regression of the lipid arc (−57.5° versus −31.4°; p=0.04), as well as a decrease of macrophage index (−3.17 versus −1.45 mm; p=0.04) and LDL level (1.6 versus 4.8 mmol/l; p<0.001).
A study by Yano et al. included 58 patients with ACS undergoing PCI. All patients received rosuvastatin 5 mg/day, of which 18 received evolocumab (140 mg/every 2 weeks).13 OCT was performed at the beginning of the study, after 4 and 12 weeks of follow-up. The results showed that an increase in the thickness of the fibrous cap of the AP (177.7 ± 33.2 µm versus 164.0 ± 30.4 µm; p<0.001) and a decrease in the macrophage index (7.0 ± 1.8 versus 8.0 ± 2 0.2; p=0.002) were higher in the combination therapy group.
The ALTAIR study included 24 patients with chronic CAD or ACS and LDL levels >3.9 mmol/l.14 All patients received rosuvastatin 10 mg/day, of which 12 additionally received alirocumab (75 mg/every 2 weeks). The follow-up period was 36 weeks. OCT was performed on the first and final visit. In the alirocumab group, the fibrous cap thickness increased more than in the monotherapy group (190 [128–220] versus 90 µm [60–125]; p=0.001), and the macrophage index was lower (−28.4% [−35.3 to −19.0%] versus −10.2% [−25.3 to 4.3%]; p=0.033).
All of the abovementioned studies were not powered to assess effects on cardiovascular events such as cardiac death, nonfatal MI and revascularisation. Despite that, in GLAGOV fewer adverse cardiovascular outcomes were revealed (12.2% versus 15.3%) in the evolocumab group.9 The latest analysis from PACMAN-AMI study showed that composite clinical endpoint of death, MI and ischaemia-driven revascularisation within 1 year occurred less frequently in patients with versus without triple regression (8.3 versus 18.2%, p=0.04). Triple regression was defined by the combined presence of percent atheroma volume (PAV) reduction, maxLCBI4mm reduction, and minimal fibrous cap thickness increase.52
The ARCHITECT study was designed as an open, multicentre, single-group study and included 104 patients with familial hypercholesterolaemia without clinical manifestations of coronary atherosclerosis.15 In addition to high-intensity statin therapy (both with and without ezetimibe), all patients received alirocumab (150 mg/every 2 weeks). CTCA was performed at the beginning of the study and after 78 weeks of treatment. As a result, the volume of AP changed from 34.6% (32.5–36.8%) at admission to 30.4% (27.4–33.4%) on the final visit (p<0.001). AP morphology also changed with an increase in the proportion of calcified (+0.3%; p<0.001) and fibrotic (+6.2%; p<0.001) plaque, while the percentage of fibrous-fatty (−3.9%; p<0.001) and necrotic (−0.6%; p<0.001) plaque decreased. Median LDL originally was 7.7 (6.5–9.7) mmol/l and at the end of the study was 2.5 (2.0–3.6) mmol/l (p<0.001).
Conclusion
Significant progress in the development of cardiovascular imaging has made it possible to expand understanding of the morphology of AP, the features of coronary vessel remodelling, and the development of acute cardiovascular complications. Combined lipid-lowering therapy seems to be the most proven option for effective treatment of vulnerable APs based on the available research studies and data. 
Clinical Perspective
- Atherosclerotic plaque destabilisation develops due to several processes in the vascular wall, such as ferroptosis, necroptosis, secondary necrosis, pyroptosis and inflammation.
- The presence of unstable (vulnerable) atherosclerotic plaques can be assessed by coronary artery imaging techniques, which provide high-resolution images.
- The use of modern lipid-lowering drugs has a stabilising effect on atherosclerotic plaques and reduces the likelihood of progression of vascular remodelling.